Wazuh is a security platform that combines XDR and SIEM for monitoring and protecting endpoints and cloud workloads [Link]. Agents are available for virtually any platform: Linux, Windows, MacOS, Solaris, HPUX, and AIX.

Bare minimum requirements (start small and expand as needed):
- 2 vCPU
- 4 GB of RAM
- 50 GB of Storage
These requirements are half of what the official documentation recommends, yet I managed to monitor over 50 endpoints at 2.5% average CPU utilization and 65 to 85% RAM usage. The key factor in my case is that I only monitor Linux servers with no interactive users, just automated workloads. This keeps the event volume to a minimum.
INSTALLATION
curl -sO https://packages.wazuh.com/4.11/wazuh-install.sh && sudo bash ./wazuh-install.sh -a
The installation takes a few minutes. Once complete, it will print the generated Admin password:
INFO: Starting Wazuh installation assistant. Wazuh version: 4.11.0
INFO: Verbose logging redirected to /var/log/wazuh-install.log
(...)
INFO: --- Summary ---
INFO: You can access the web interface https://<wazuh-dashboard-ip>:443
    User: admin
    Password: XXXXXXXXXXXXXXXXXXXXXXXXXXXXXXXX
24/03/2024 14:23:29 INFO: Installation finished.
Navigate to the URL and log in with the generated credentials.
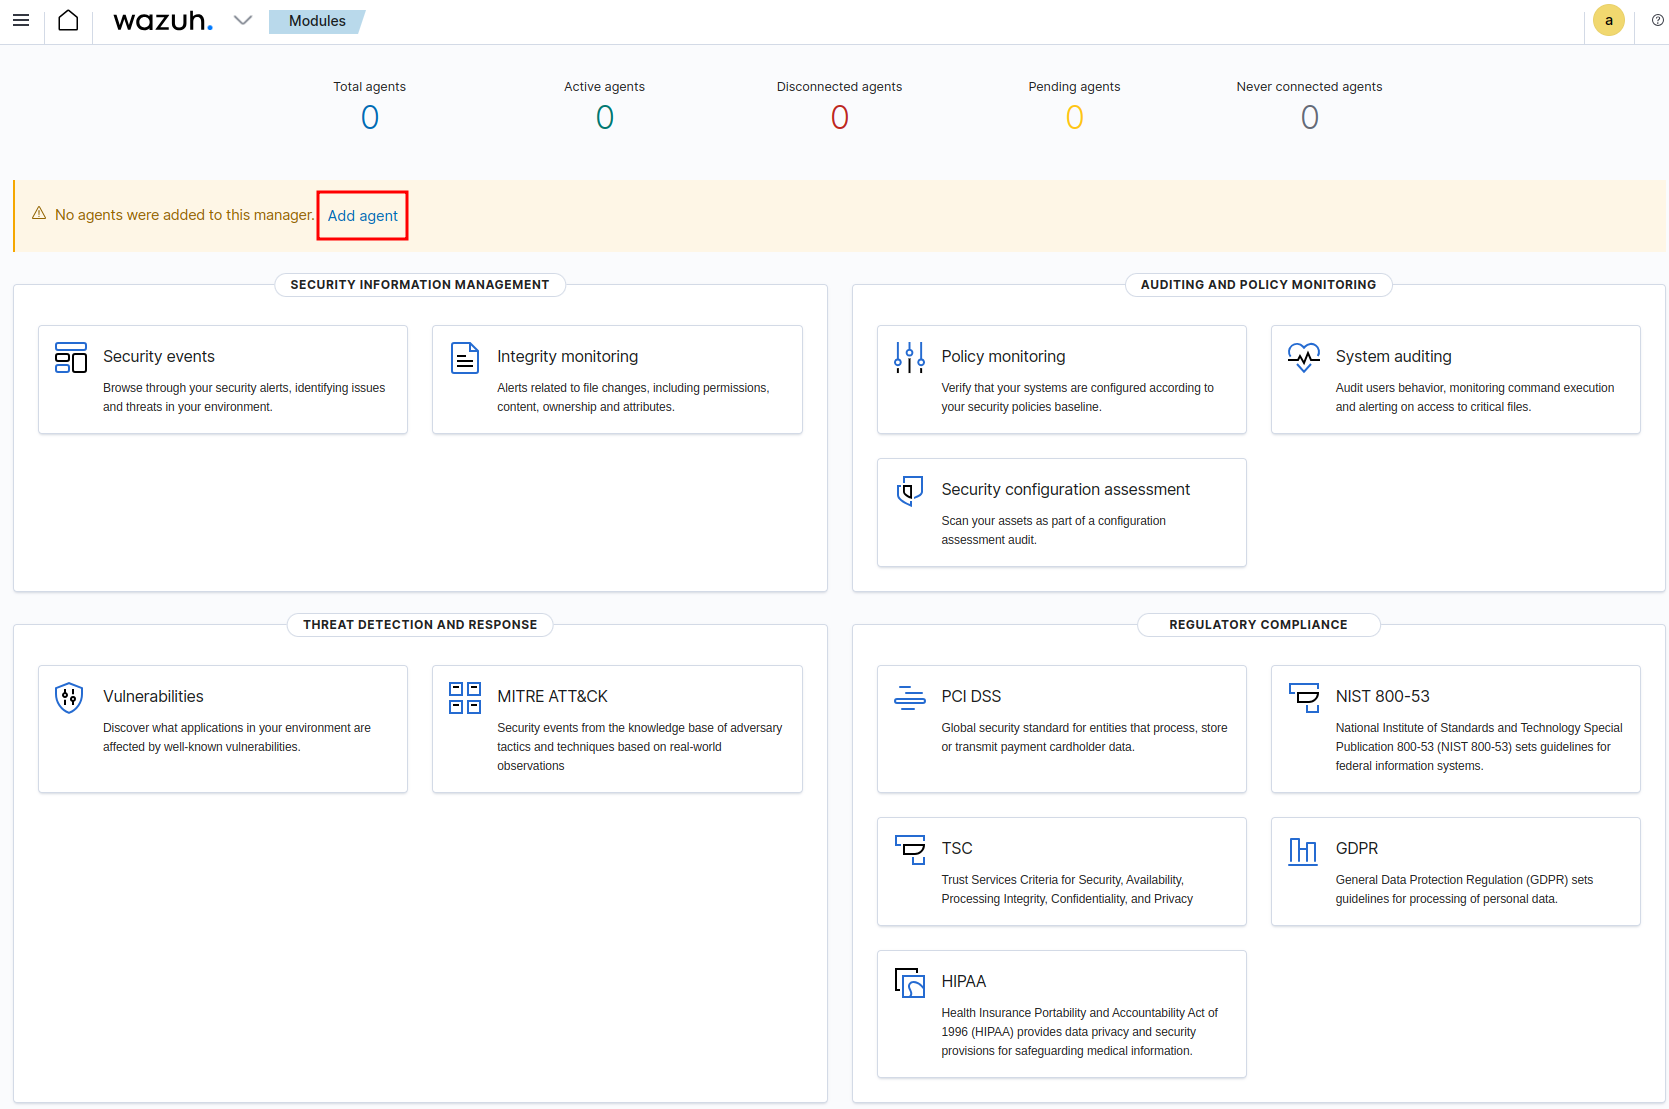
SETTING UP AGENTS
After logging in to the Dashboard, click on Add Agent.
Select the platform and architecture of the endpoint to be monitored, provide the server address (ideally a local hostname rather than an IP, in case the IP changes), and assign a group (I left the default).
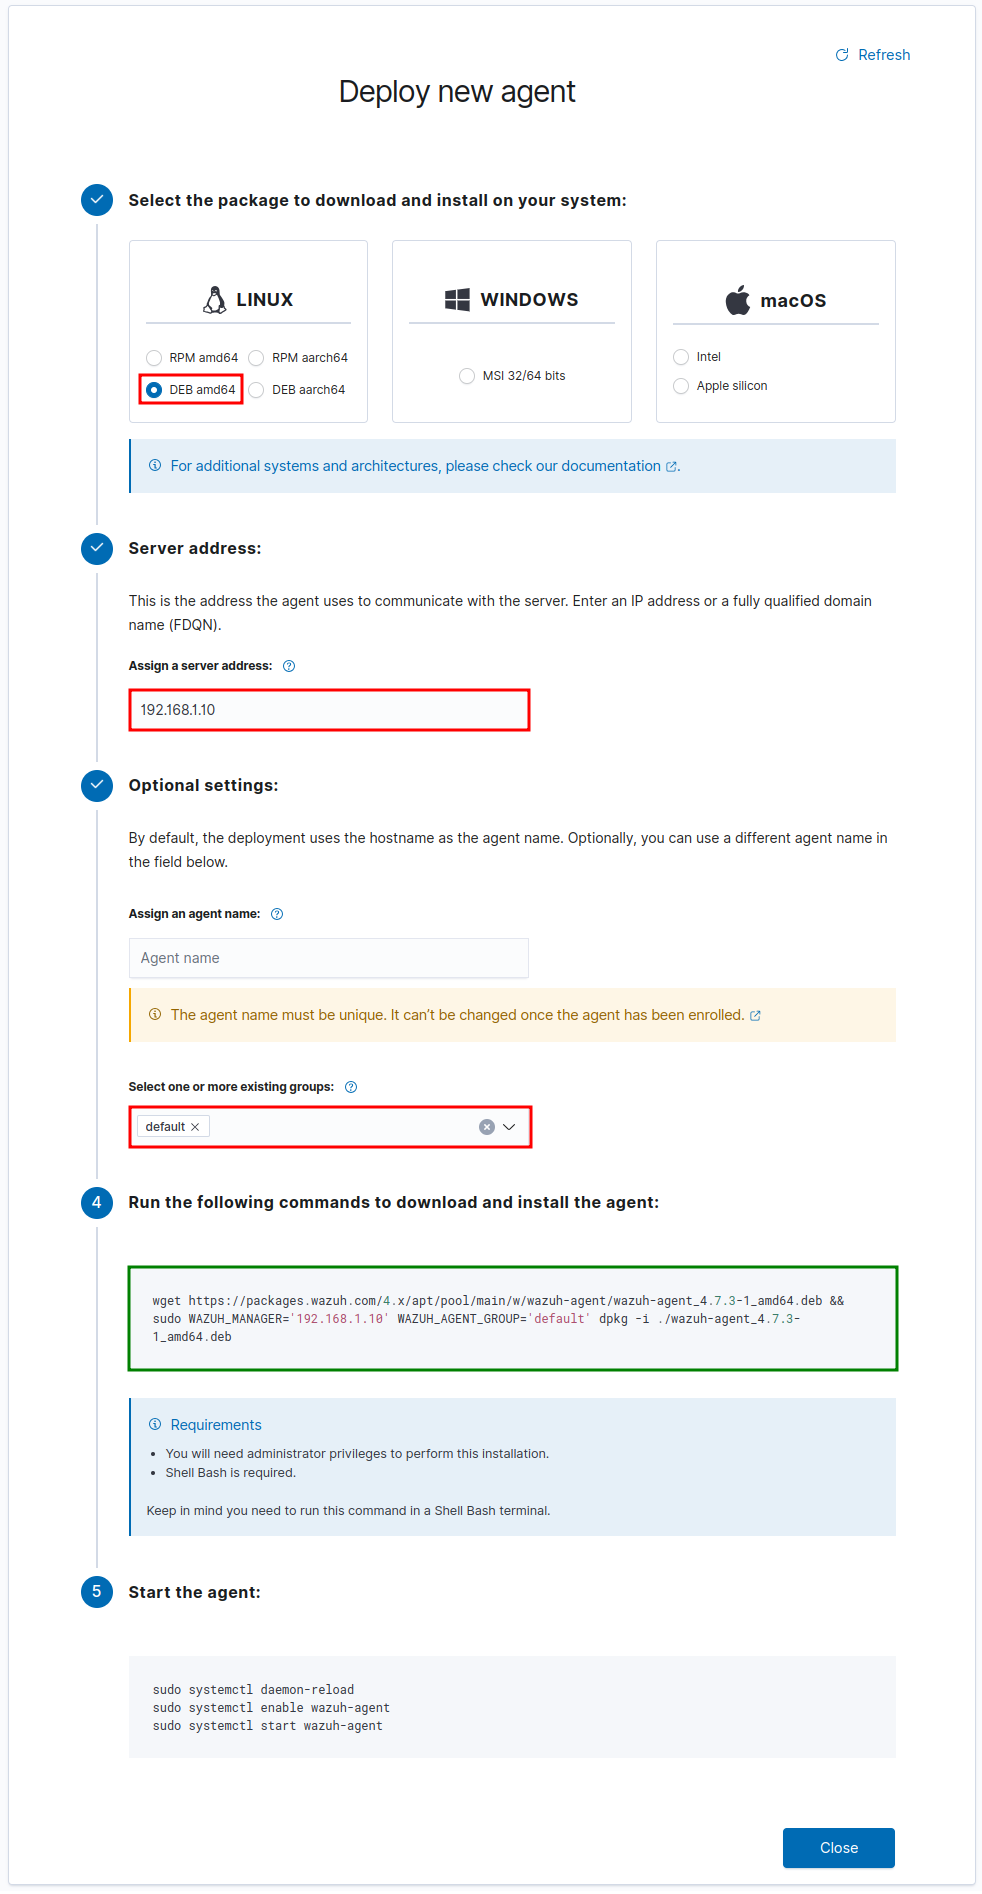
This step only generates a command to copy and run on the target host. It does not install anything automatically.
wget https://packages.wazuh.com/4.x/apt/pool/main/w/wazuh-agent/wazuh-agent_4.11.0-1_amd64.deb && sudo WAZUH_MANAGER='192.168.1.10' WAZUH_AGENT_GROUP='default' dpkg -i ./wazuh-agent_4.11.0-1_amd64.deb
The agent does not start or enable itself on boot automatically after installation. Run the following command as well:
sudo systemctl daemon-reload && sudo systemctl enable wazuh-agent && sudo systemctl start wazuh-agent
It may take a few seconds to appear under Active Agents.

All good!

If the agent does not connect to the server, check the logs for clues:
sudo tail -f /var/ossec/logs/ossec.log | grep -i -E "error|warn"
MONITORING ENDPOINTS
Click on any agent to view its events. A series of checks will run shortly after the agent joins (these are not resource-intensive).
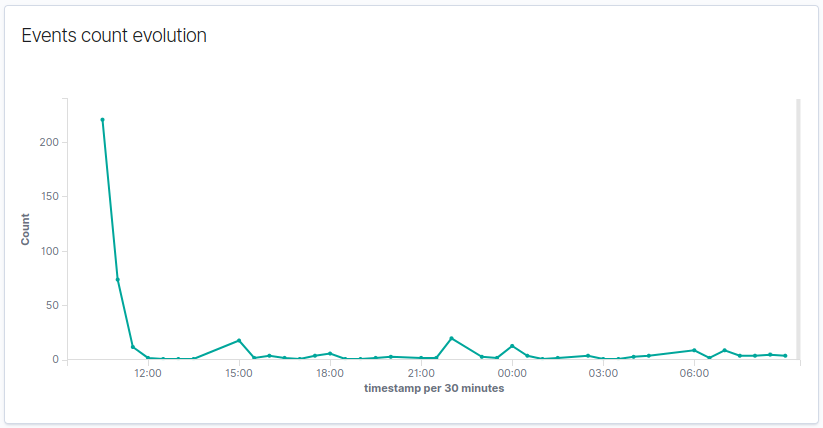
New events will continue to appear as they occur on the server.
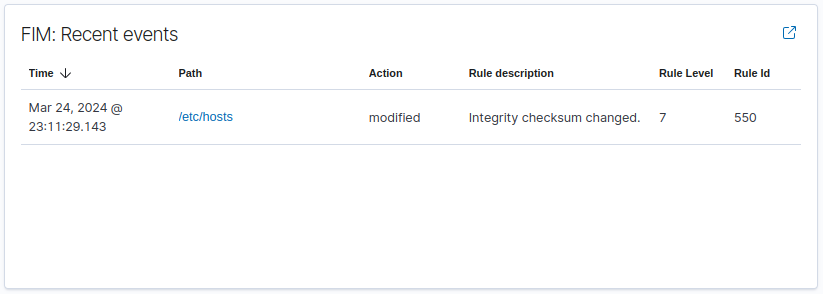
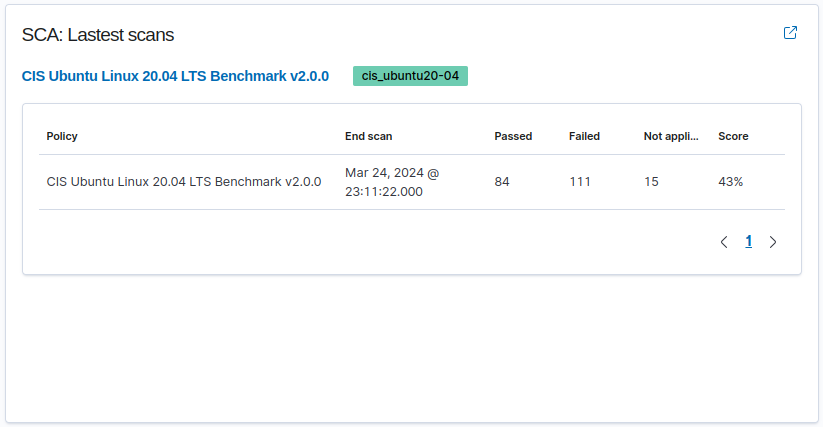
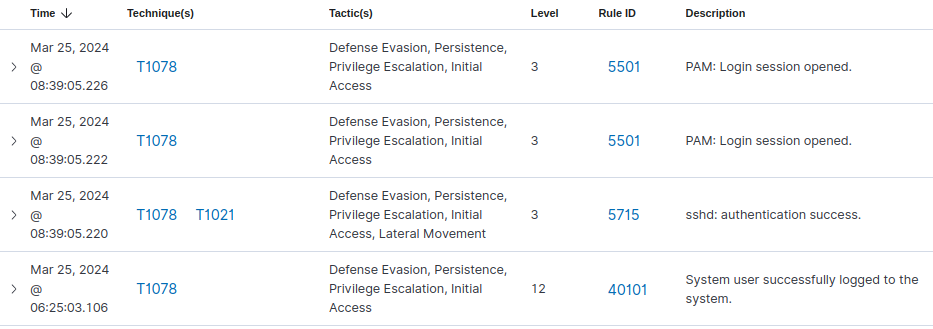
The agent summary classifies each event with a MITRE ATT&CK TTP (Tactic, Technique, and Procedure) and maps it to relevant compliance frameworks.
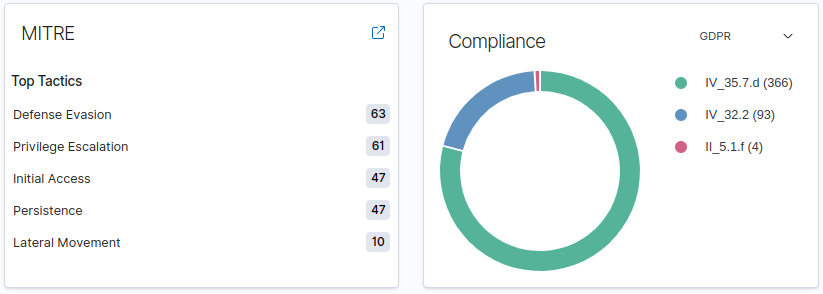
See example:
Note: Expect a lot of false positives. Distinguishing normal operation from genuine issues requires a solid understanding of the system and its applications. For example, user logins and system patches will each generate a large number of events.
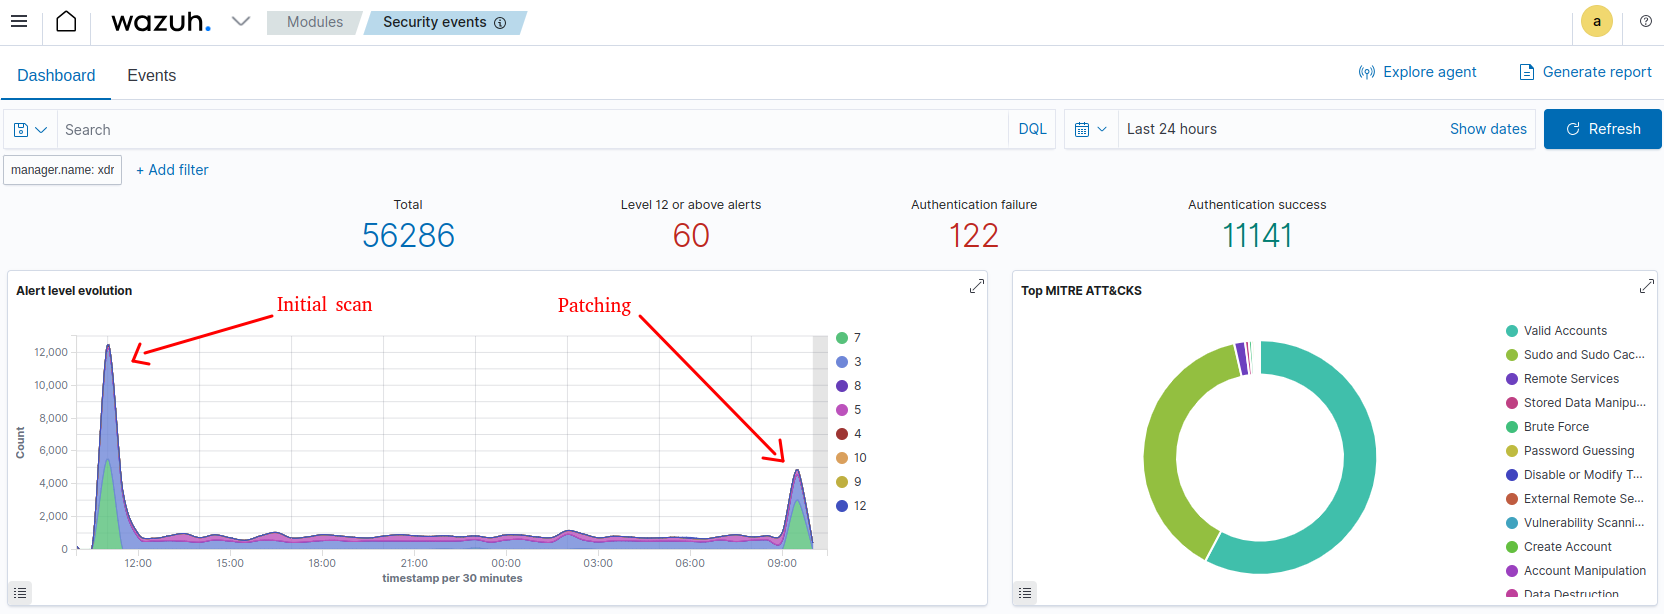
This is where the real work starts!
BONUS
Wazuh started as a fork of OSSEC. OSSEC is under slower development but remains popular and relevant in the cybersecurity space [Link].
git clone https://github.com/ossec/ossec-hids.git
cd ossec-hids
sudo apt update
sudo apt install libz-dev libssl-dev libpcre2-dev build-essential libsystemd-dev -y
./install.sh
Or via APT [Link]:
wget -q -O - https://www.atomicorp.com/RPM-GPG-KEY.atomicorp.txt | sudo apt-key add -
echo "deb https://updates.atomicorp.com/channels/atomic/ubuntu $DISTRIB_CODENAME main" >> /etc/apt/sources.list.d/atomic.list
sudo apt update
sudo apt install ossec-hids-server -y
For MS Windows endpoints, check out BLUESPAWN [Link], another open-source EDR.