The Kubernetes Dashboard is an add-on available in all major K8s platforms.
In this walk-through, I will review how to access the Web UI Dashboard for MicroK8s, Minikube, and K3s. Then, I will follow the steps from the Kubernetes Demo post [Link] to demonstrate key components when navigating the Dashboard.
ACCESSING THE DASHBOARD
MicroK8s – Explained in detail at [Link].
sudo microk8s enable dashboard
sudo microk8s kubectl create token default
sudo microk8s kubectl port-forward -n kube-system service/kubernetes-dashboard 8001:443
Minikube – Explained in detail at [Link].
minikube addons enable dashboard
minikube kubectl -n kube-system describe secret $(minikube kubectl -n kube-system get secret | awk '/^deployment-controller-token-/{print $1}') | awk '$1=="token:"{print $2}'
minikube kubectl proxy --address='0.0.0.0' --disable-filter=true
K3s – Explained in detail at [Link].
k3s kubectl -n kubernetes-dashboard create token admin-user
k3s kubectl proxy
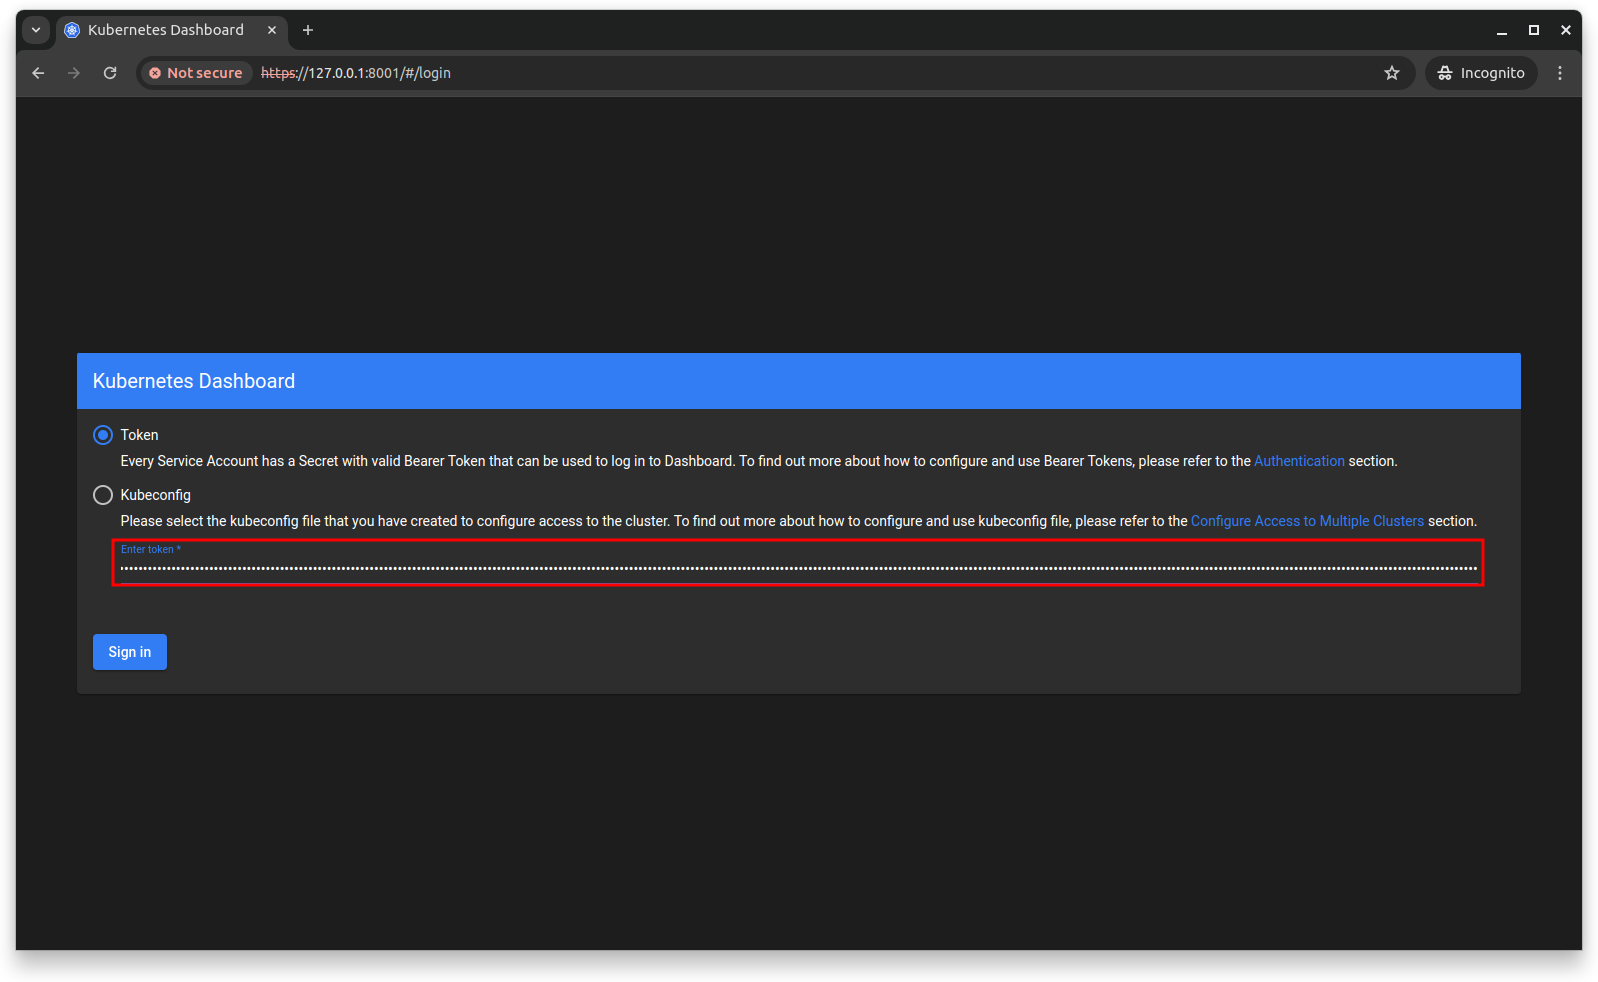
- IN ALL CASES
- Navigate to http://127.0.0.1:8001 (if it fails, try HTTPS) and paste the generated token.
DASHBOARD WALK-THROUGH
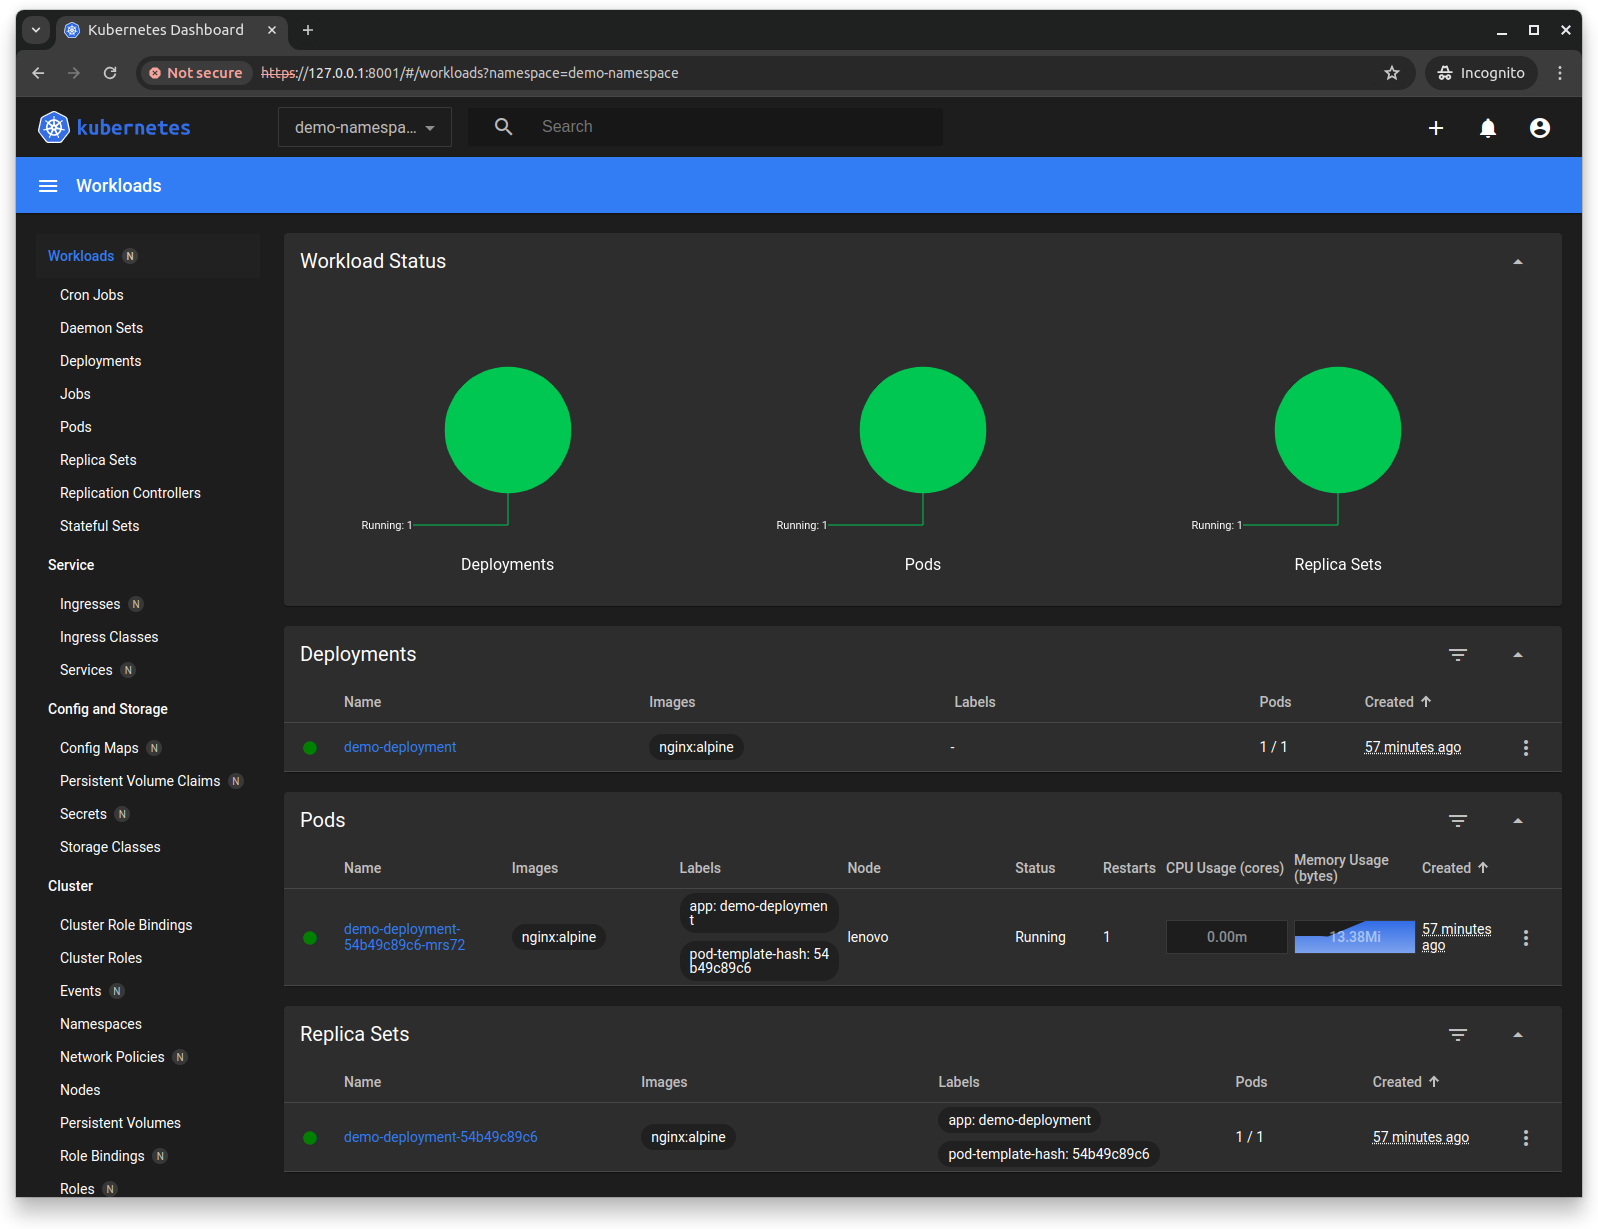
For this walk-through, I previously deployed demo resources from the Kubernetes Demo post [Link], which are also available in this public repository [Link].
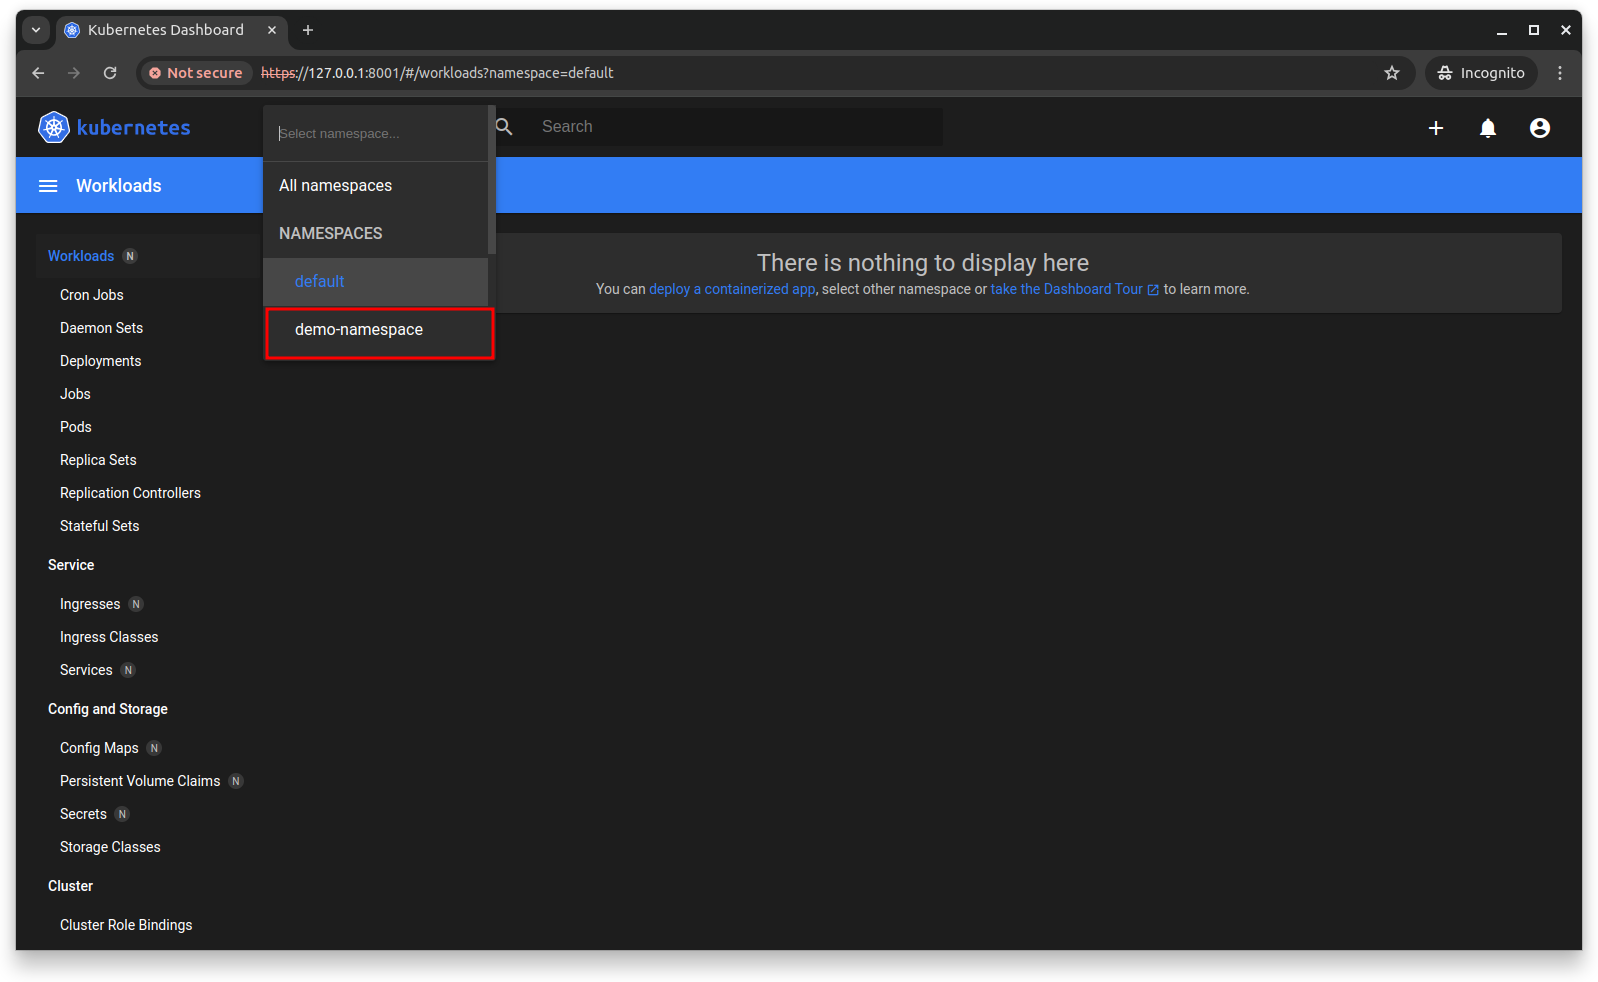
Switch to the created Namespace.
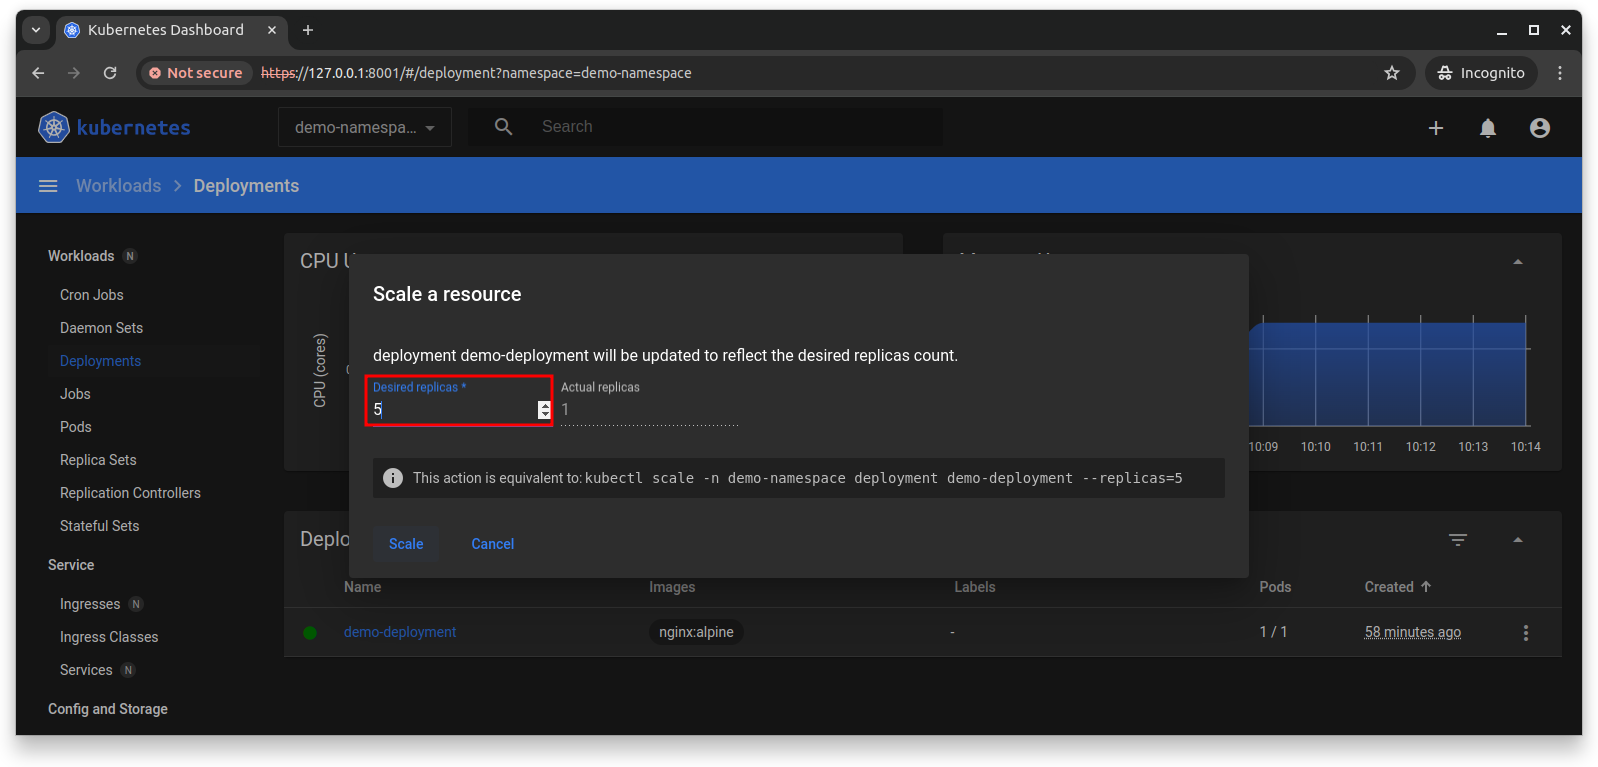
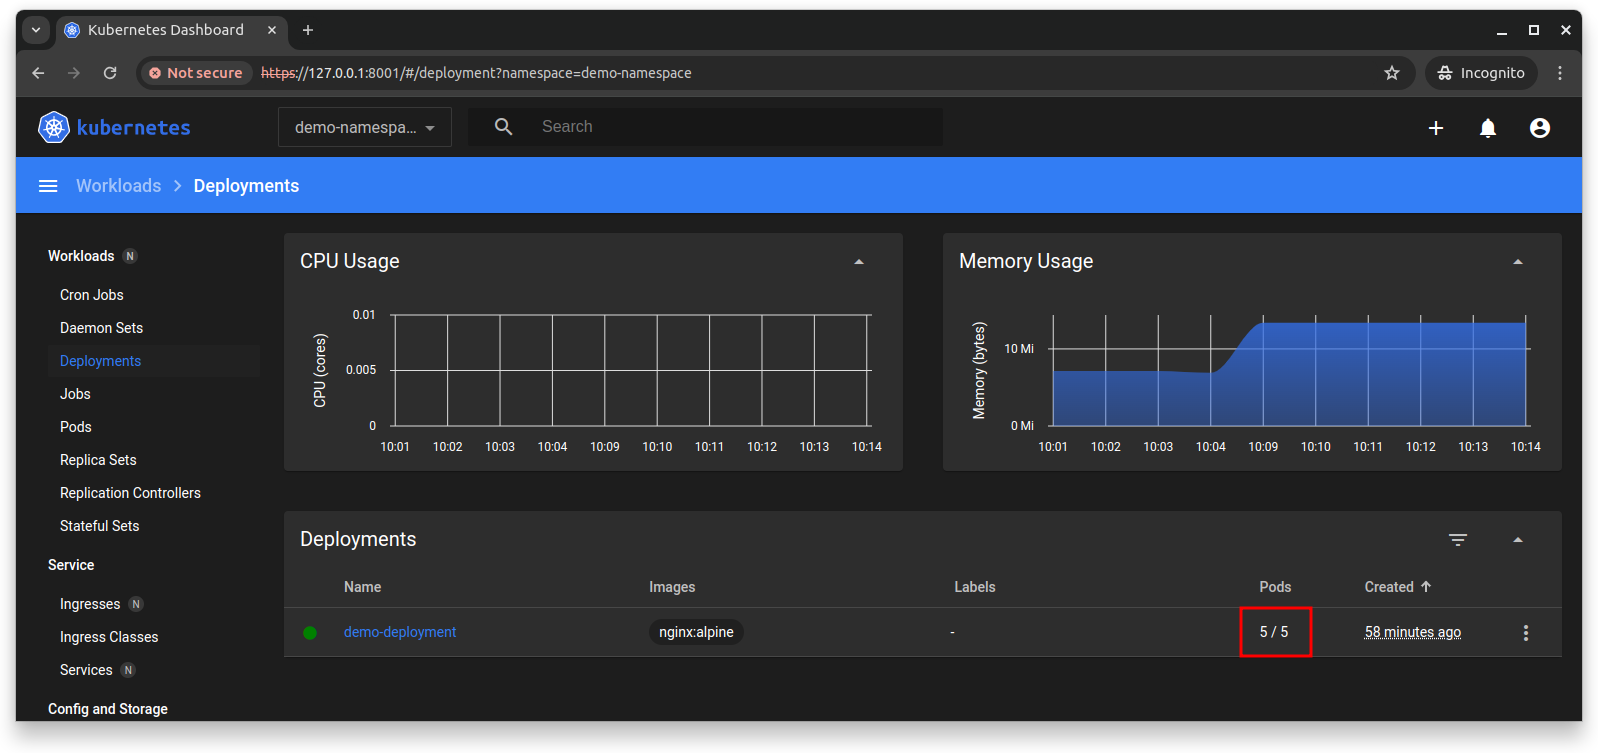
In Deployments, first scale up the desired capacity to 5, then edit the deployment configuration.
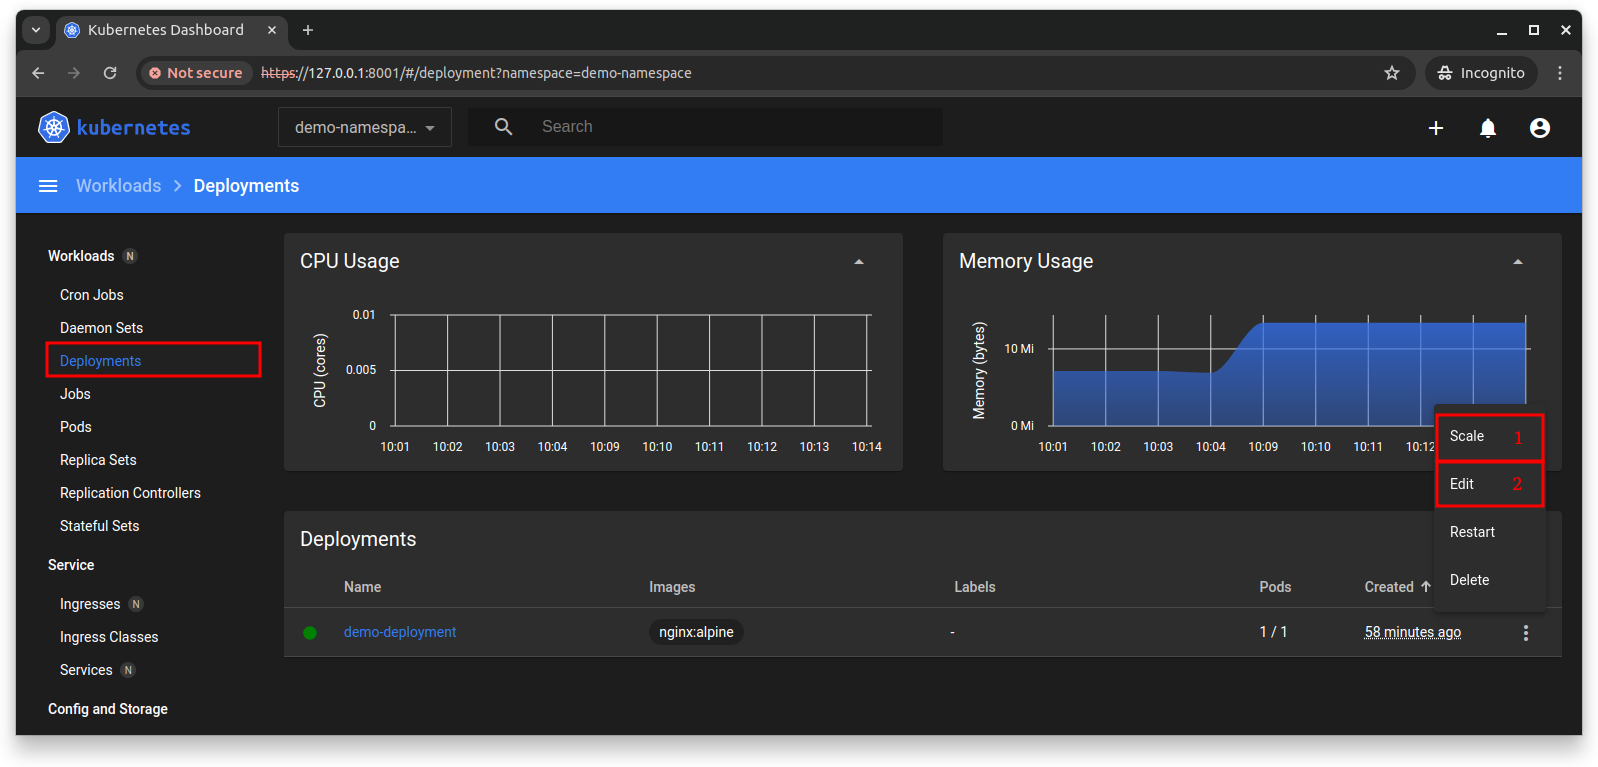
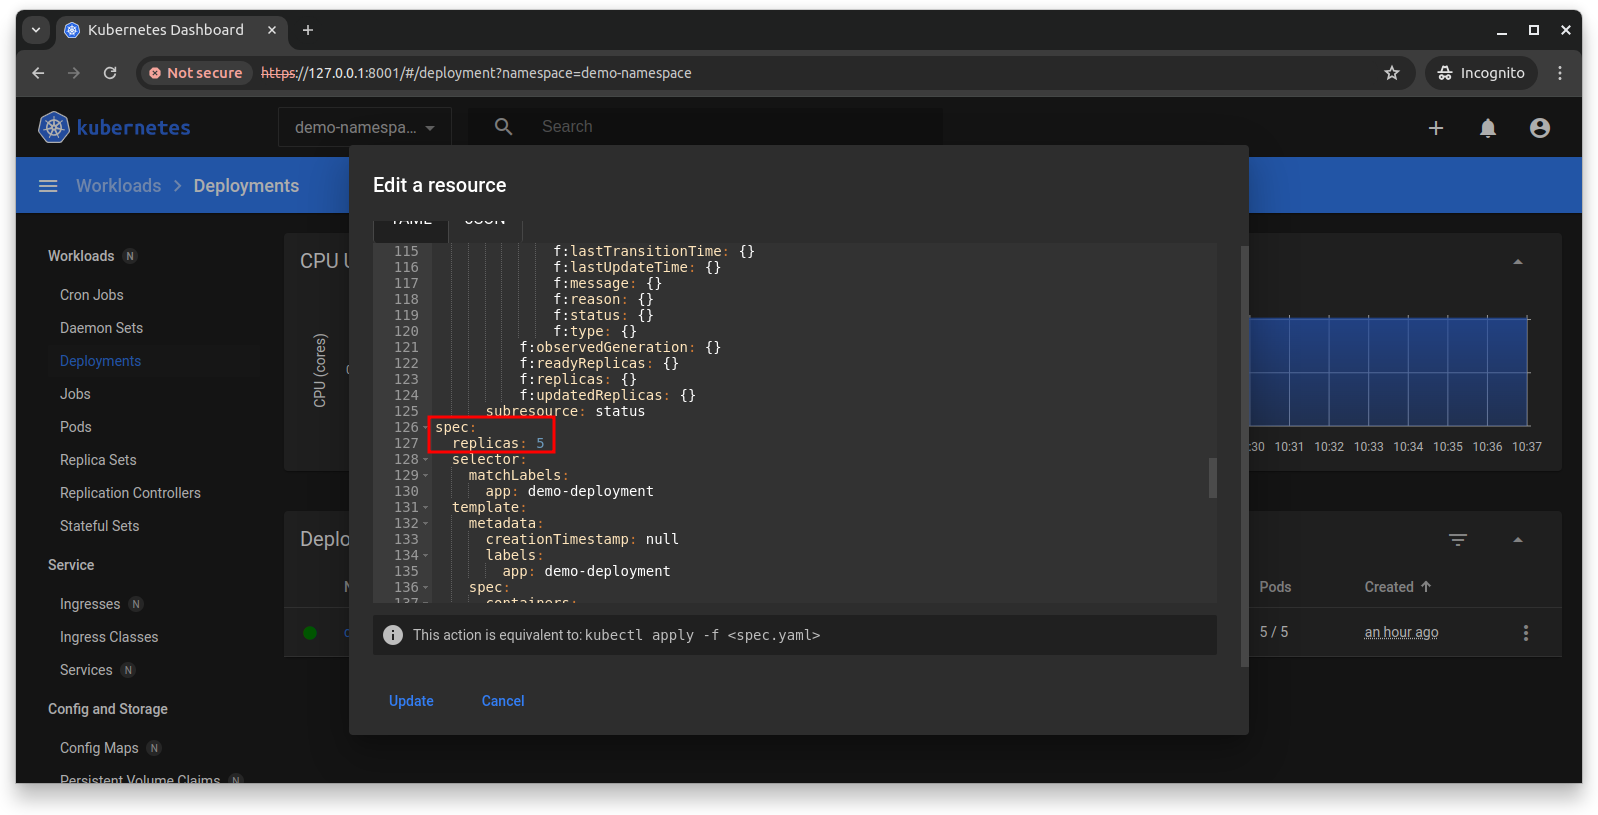
Note that the manifest was updated in the cluster, not in the source deployment.yaml.
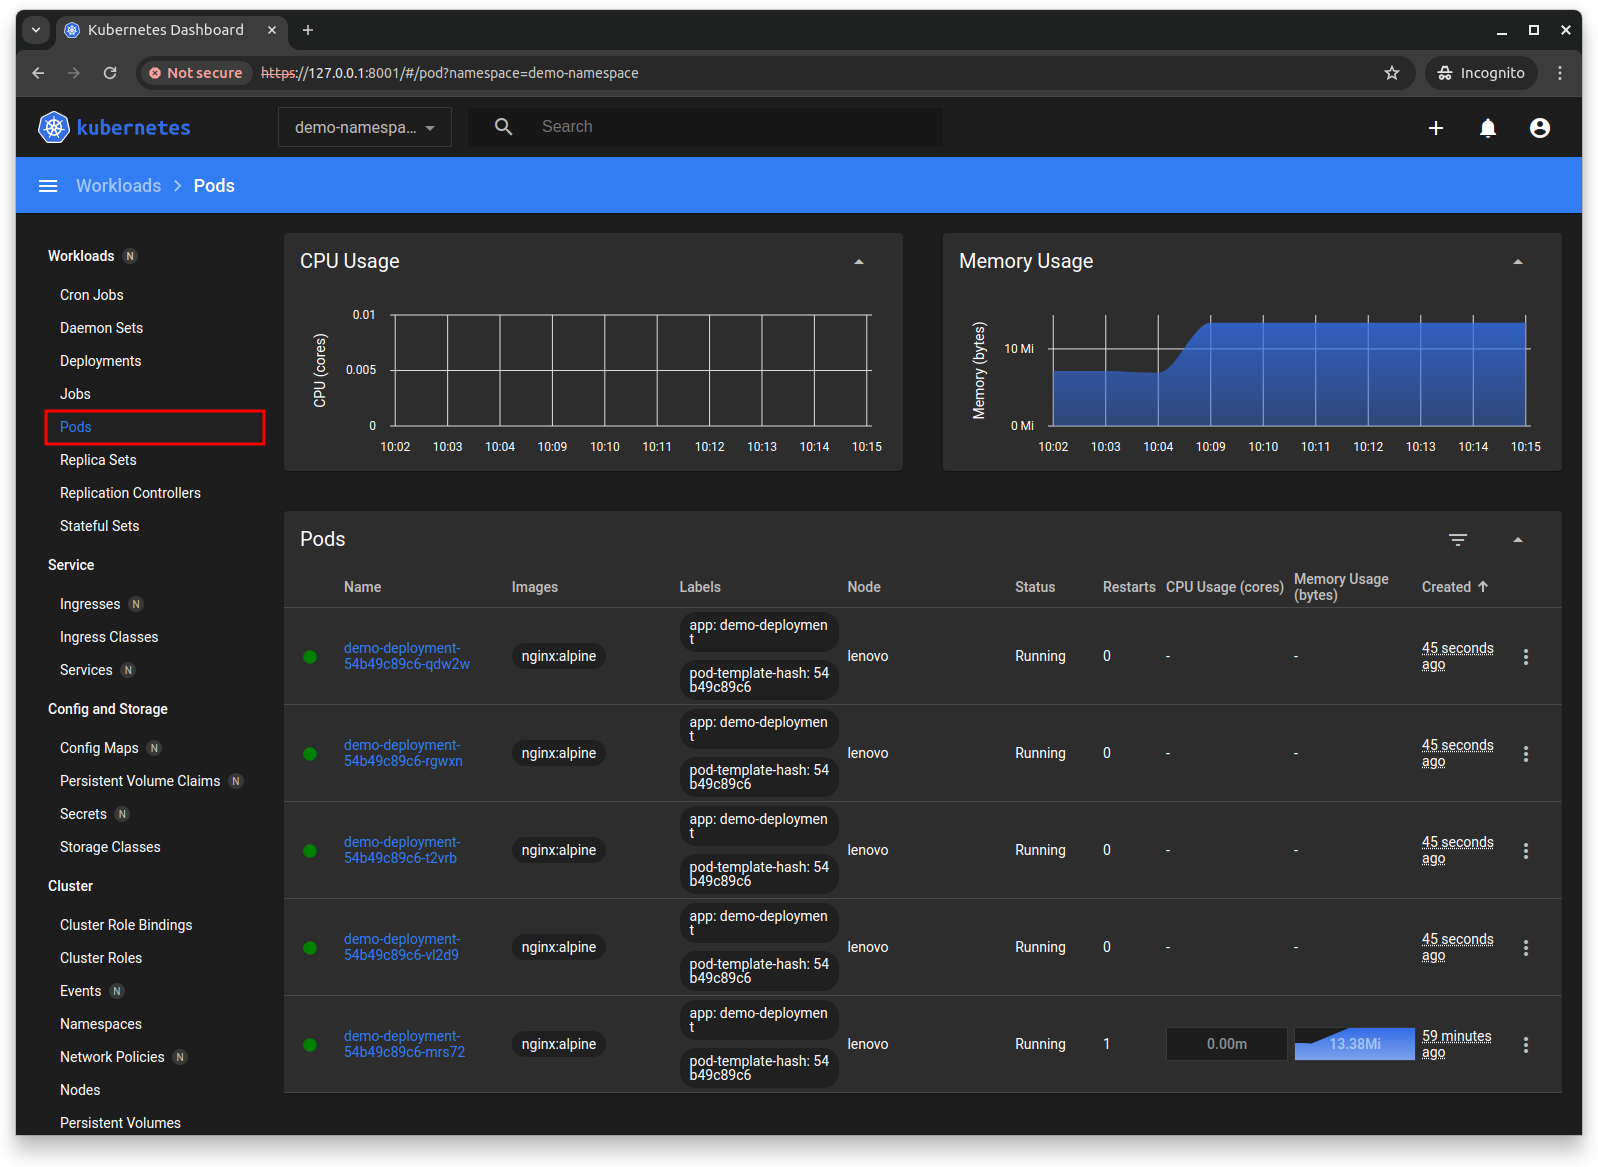
In Pods, there are now 5 pods running: the original single replica plus the 4 newly scaled replicas.
Check out Logs and Exec.
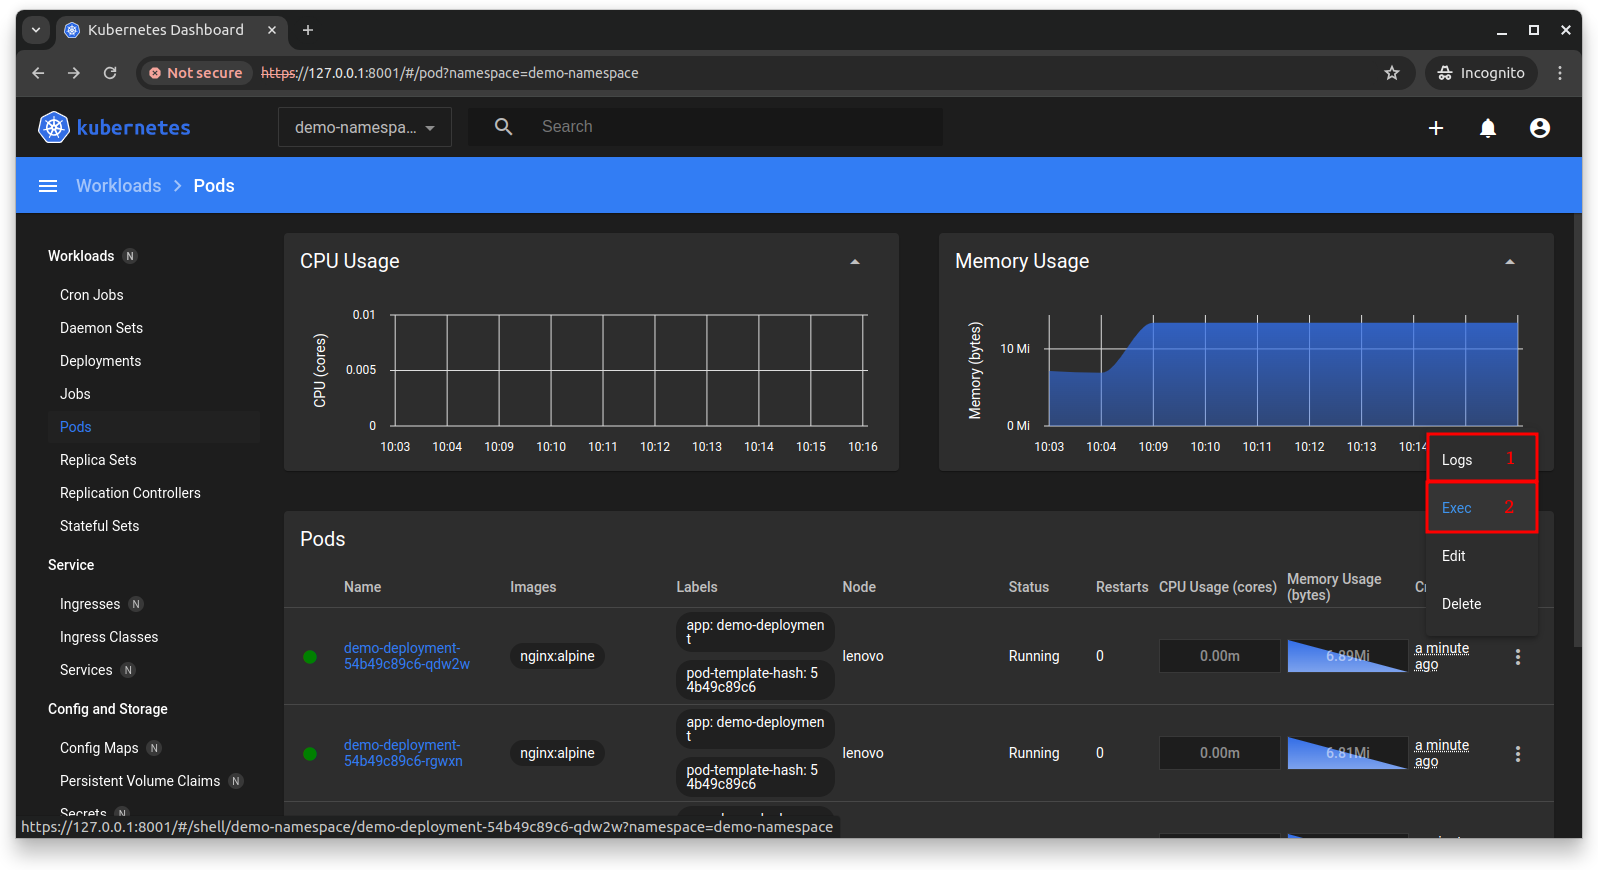
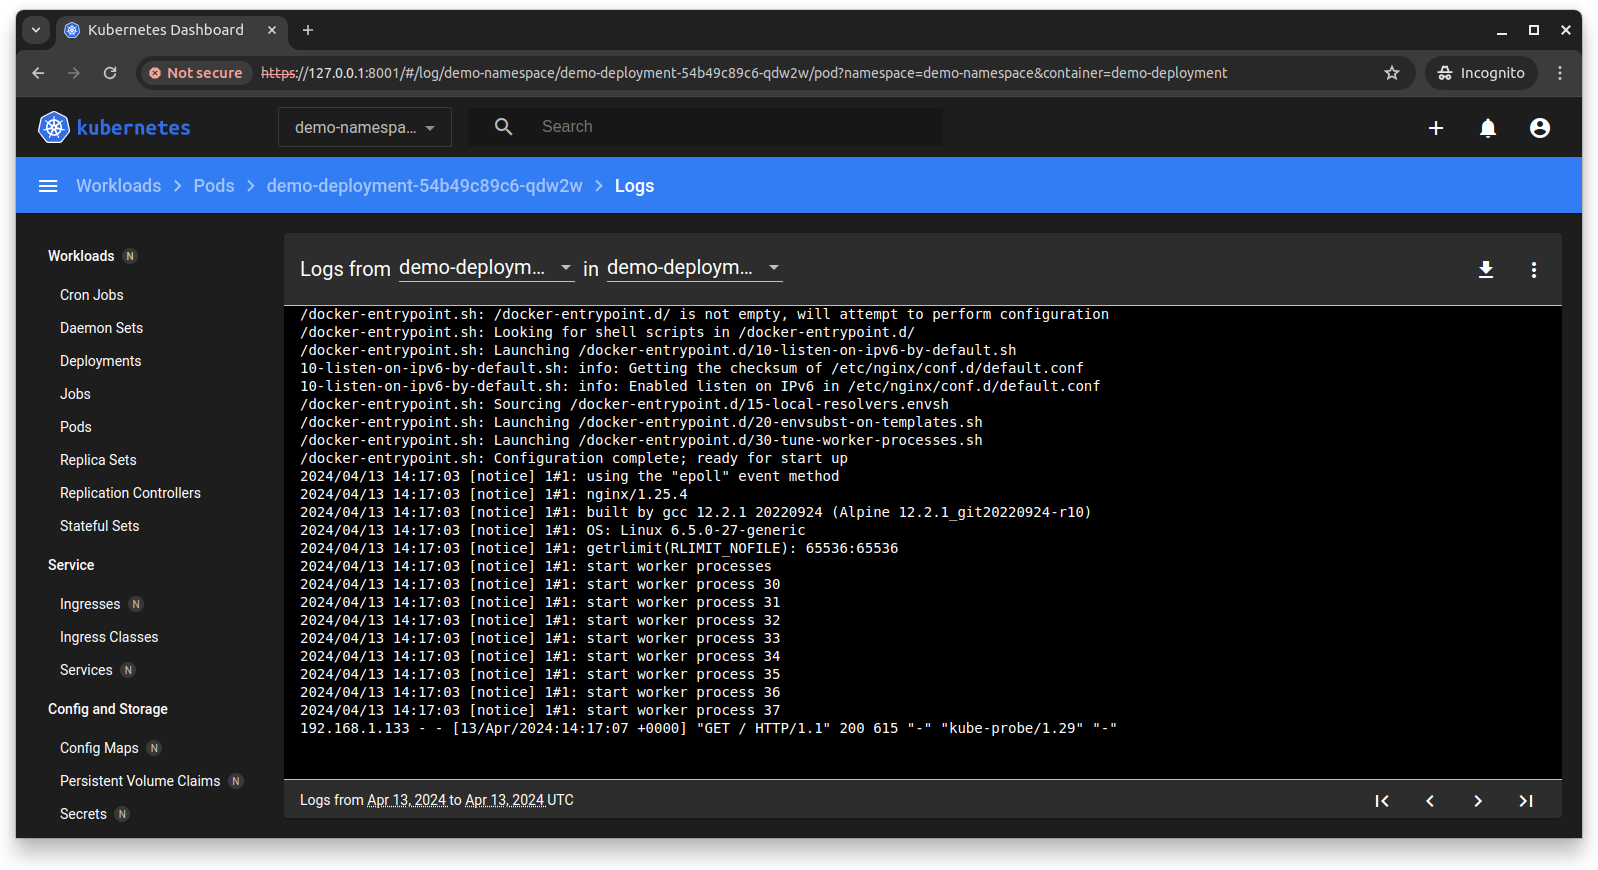
Logs shows the container’s console output.
Exec opens a shell inside the container with full permissions.
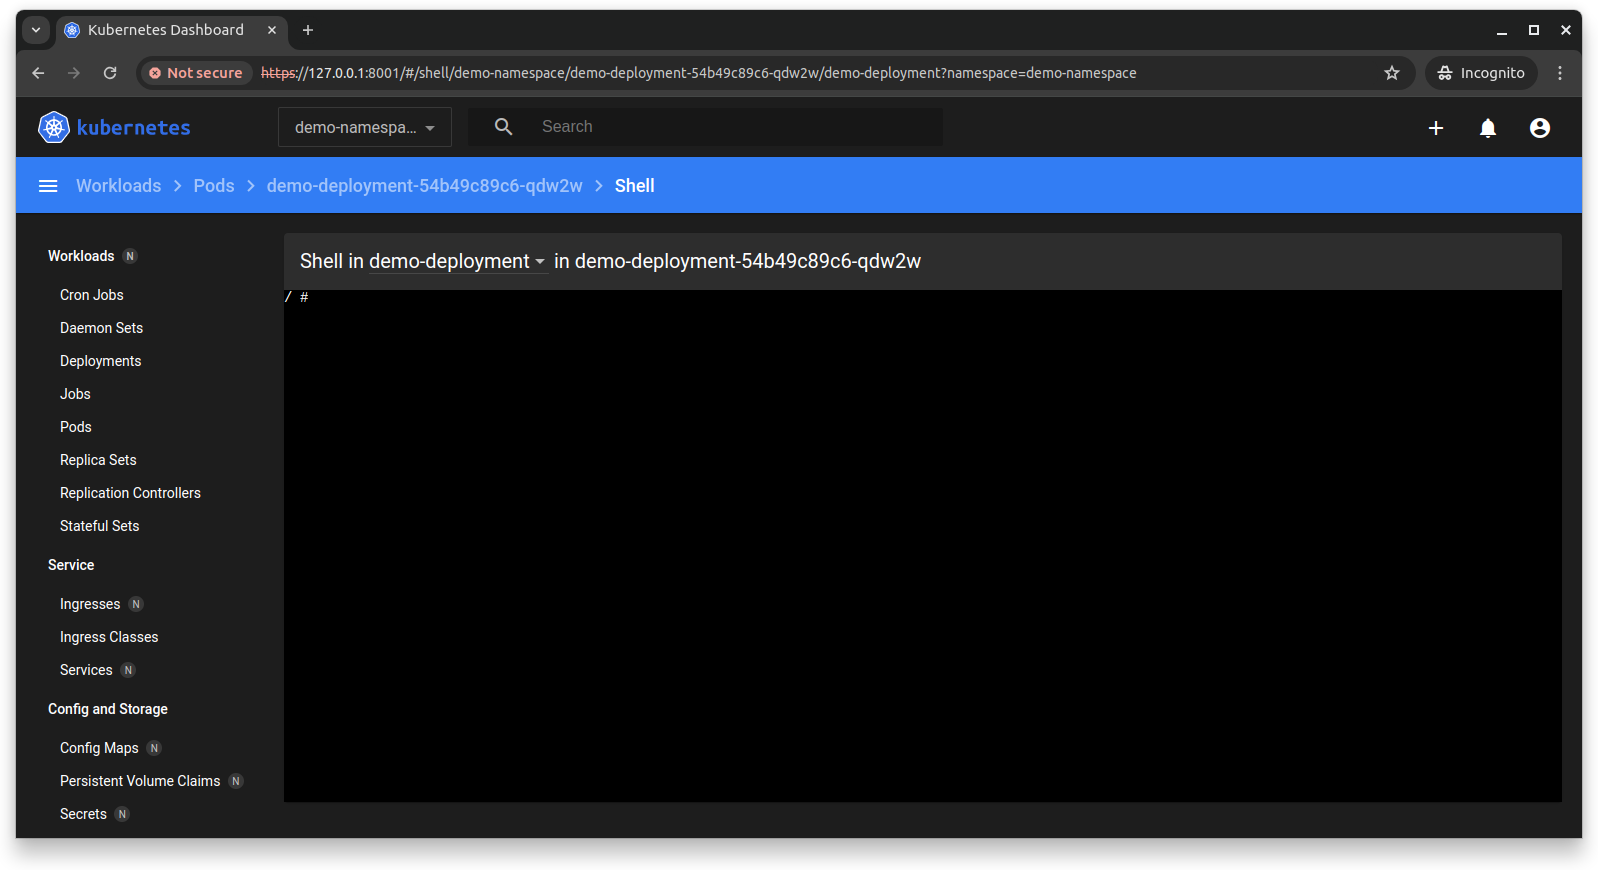
Both Logs and Exec are useful features for development and troubleshooting.
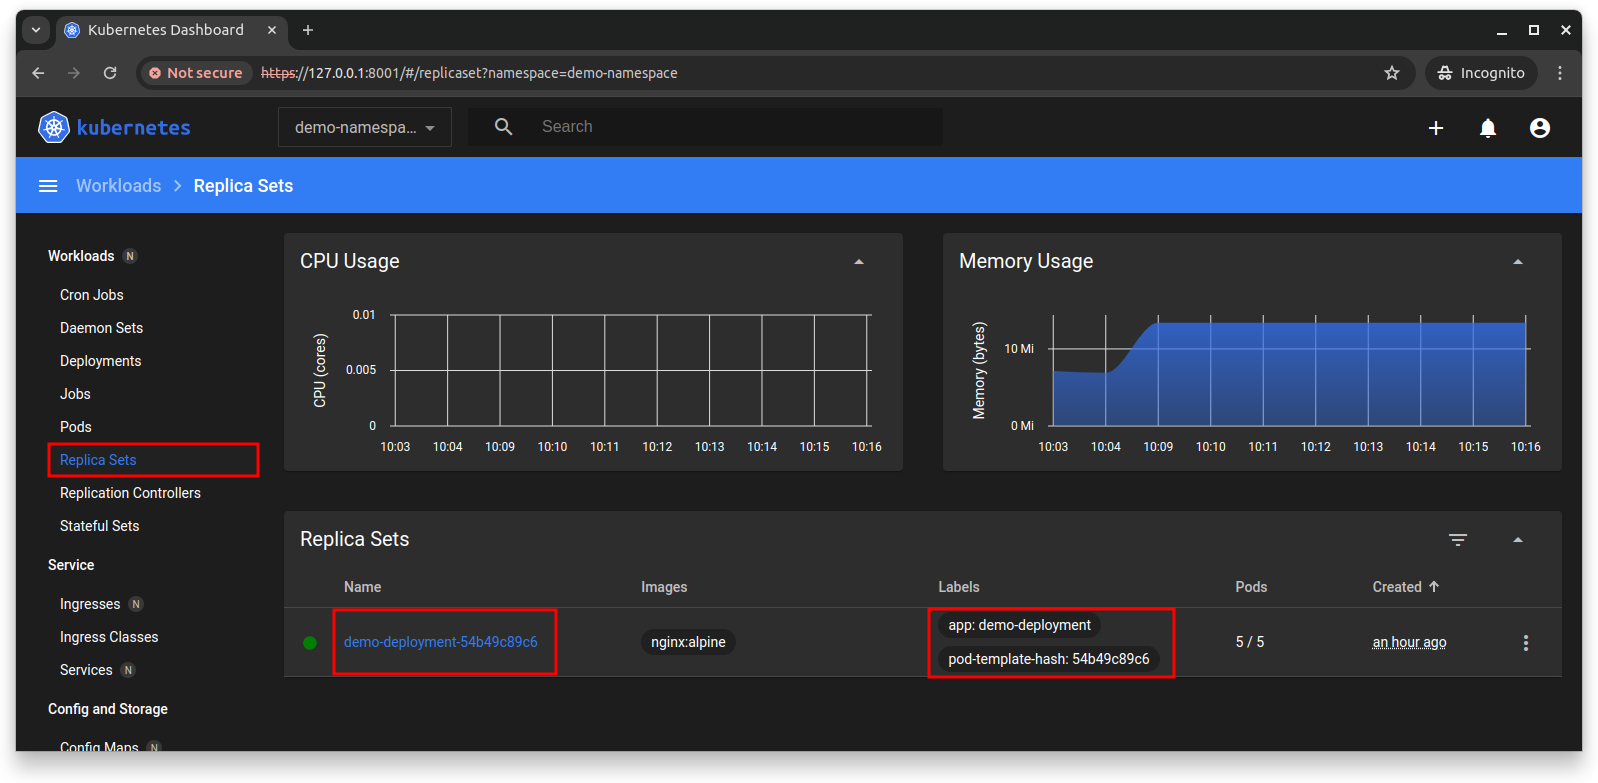
In Replica Sets, similar features are available such as Logs and Scale, along with additional resource information.
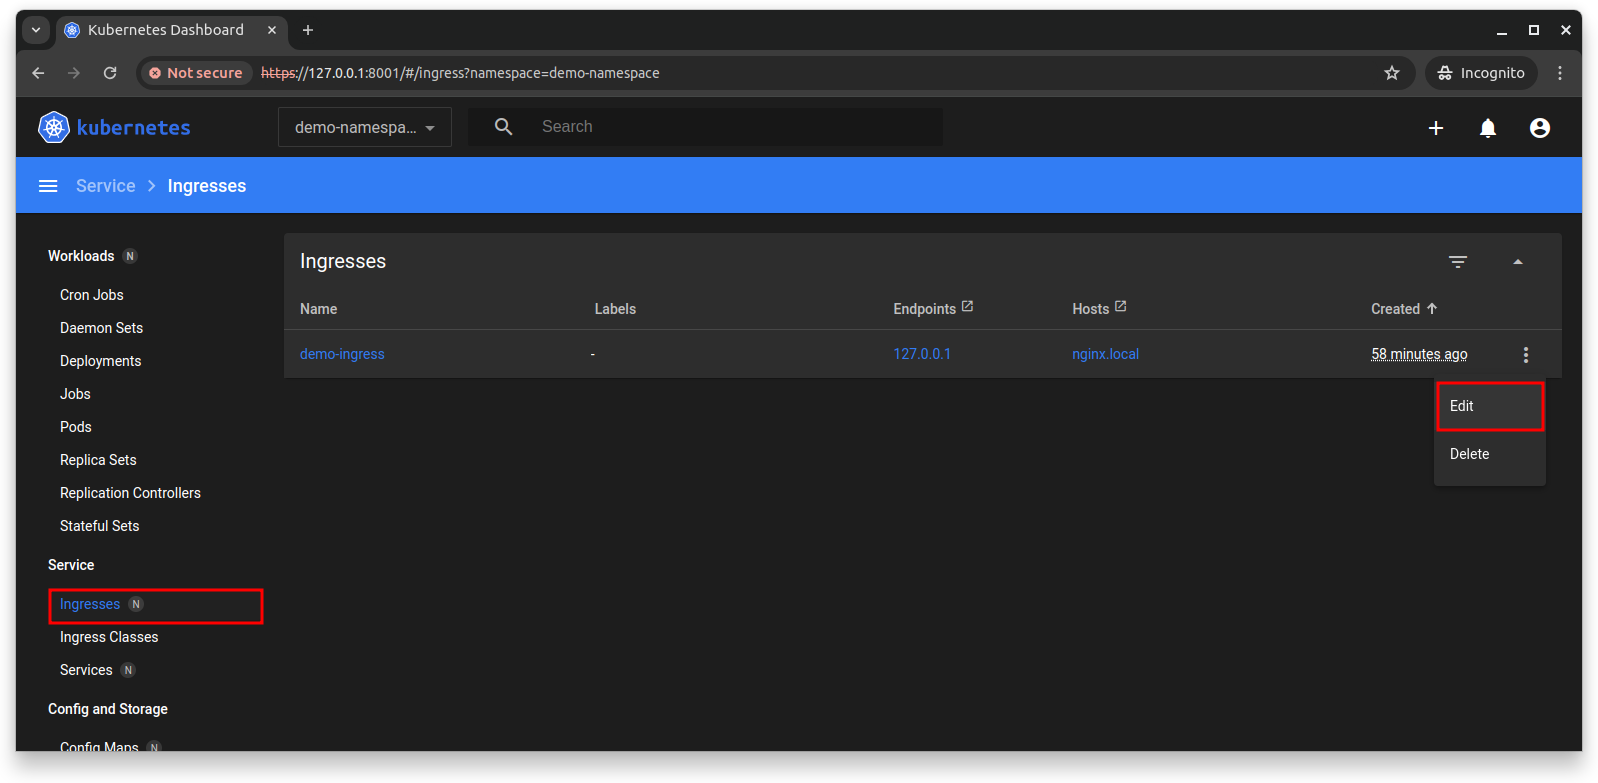
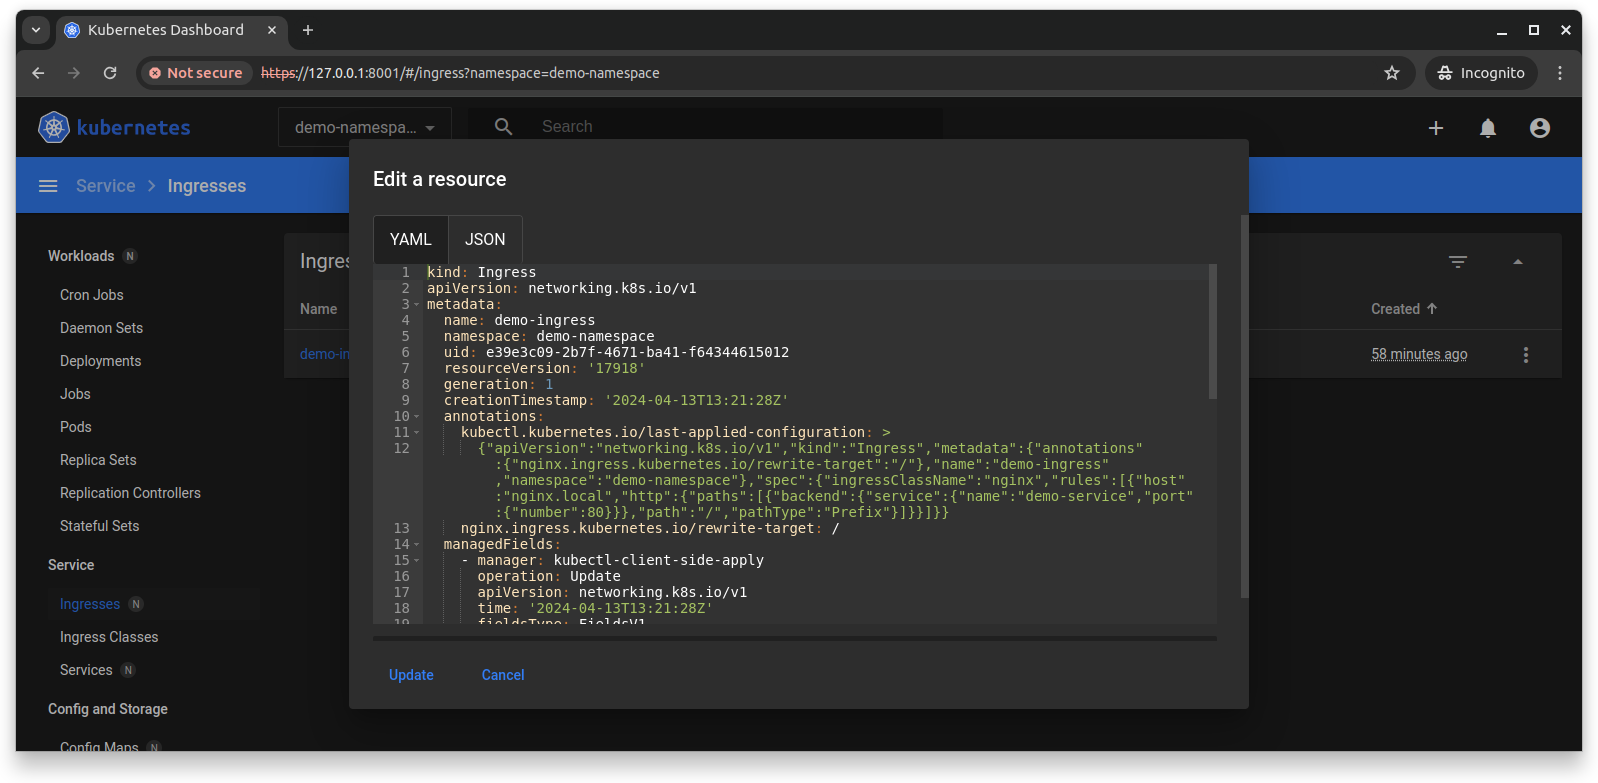
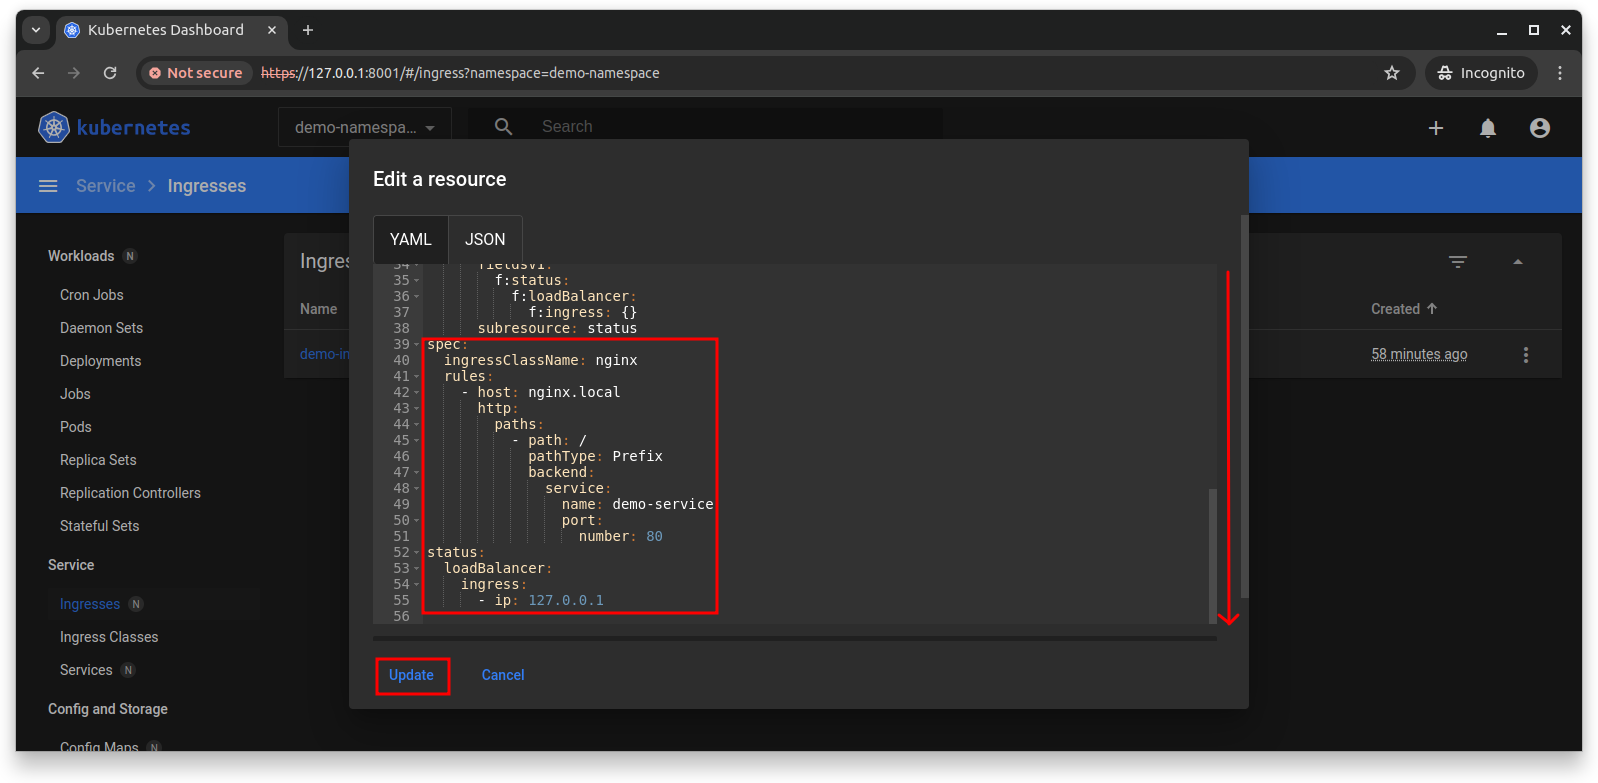
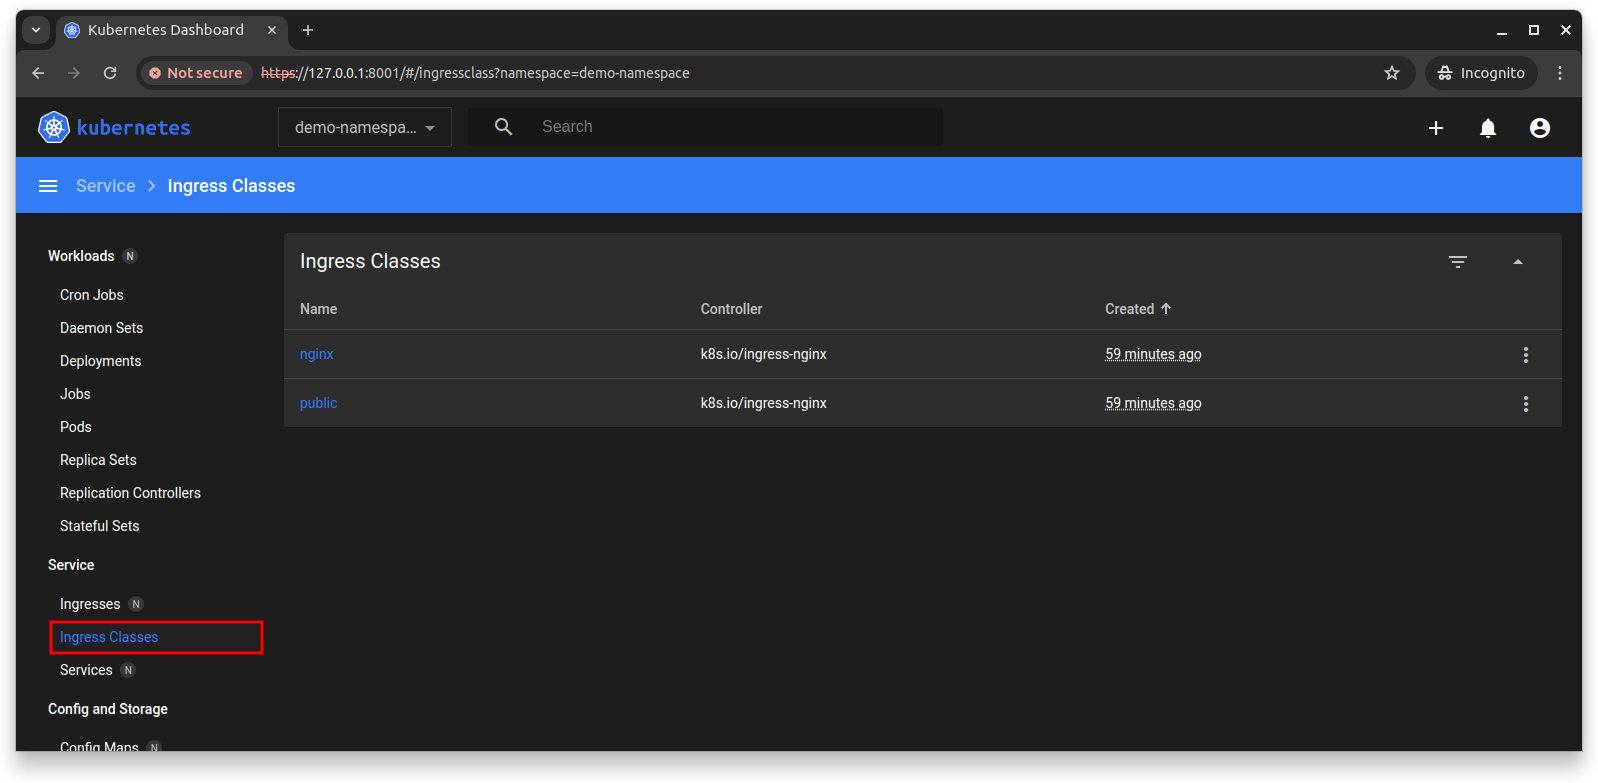
In the Service section, navigate to Ingresses. These can also be edited manually in YAML or JSON.
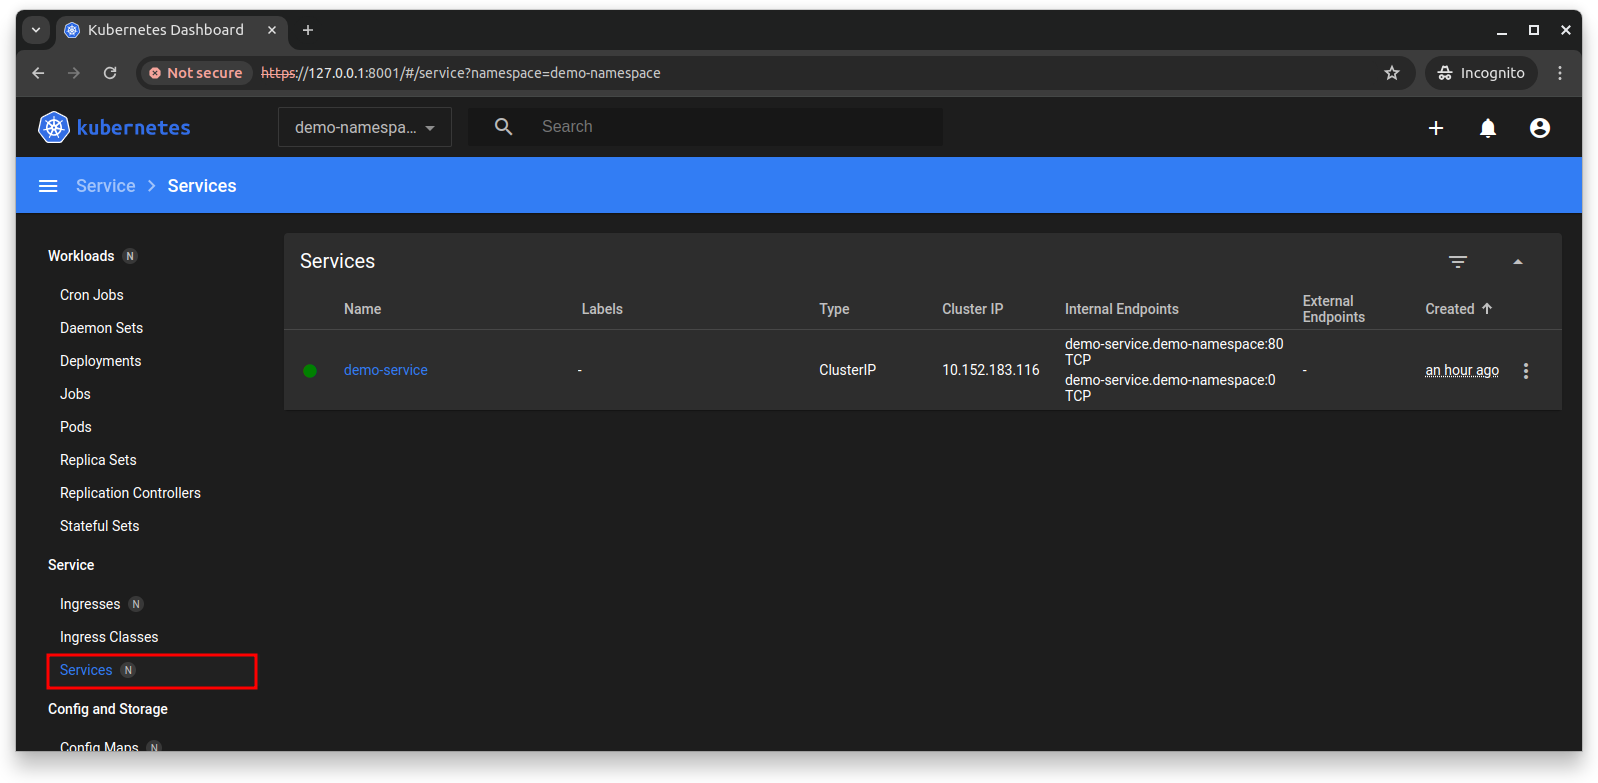
The same applies to Ingress Classes and Services.
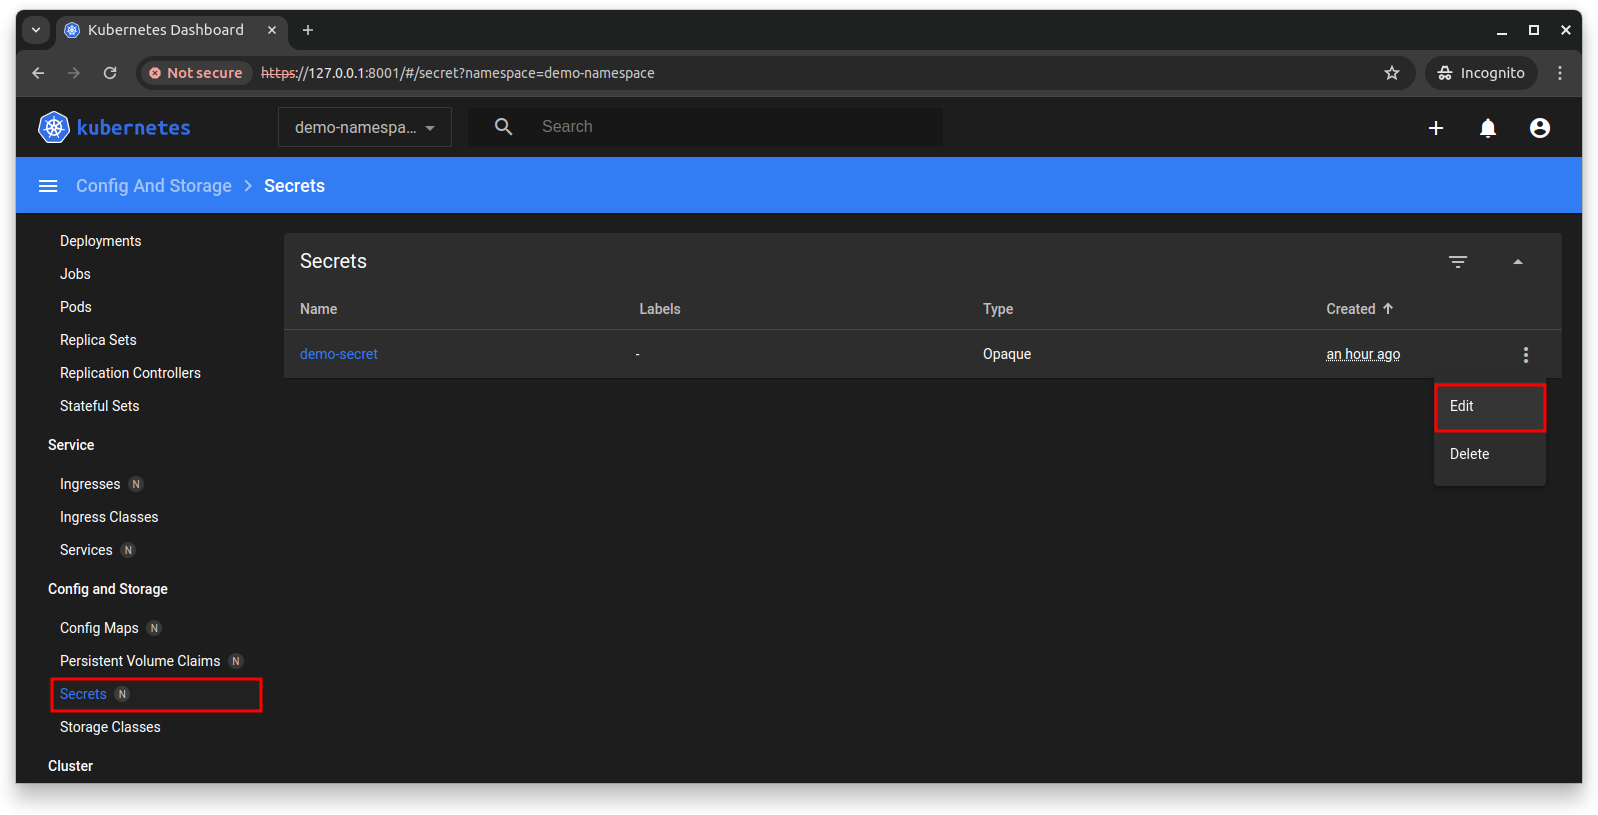
Under Config and Storage, navigate to Secrets and edit a secret.
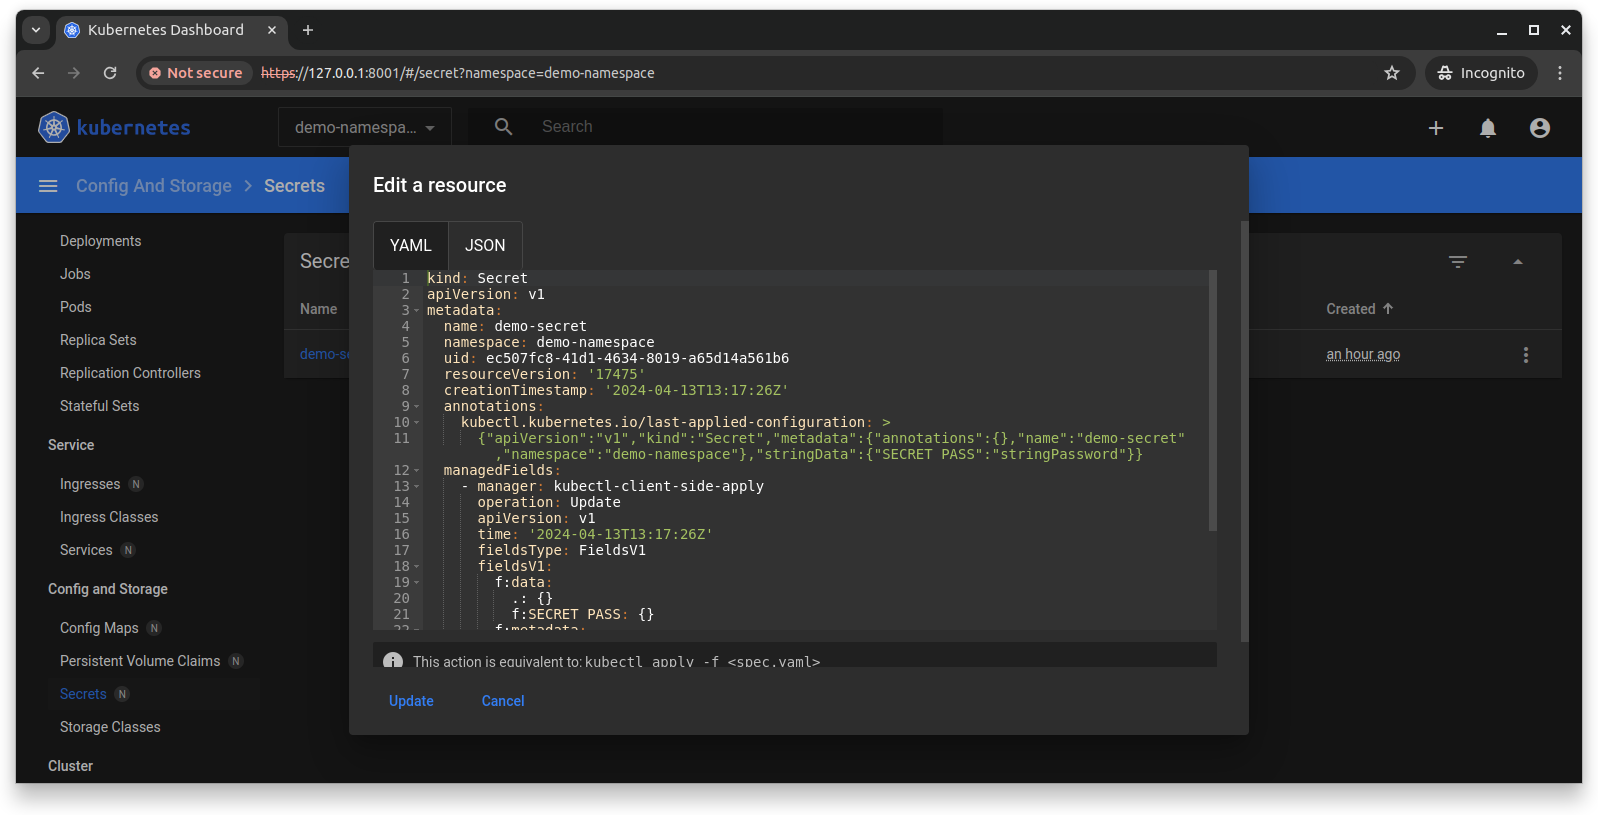
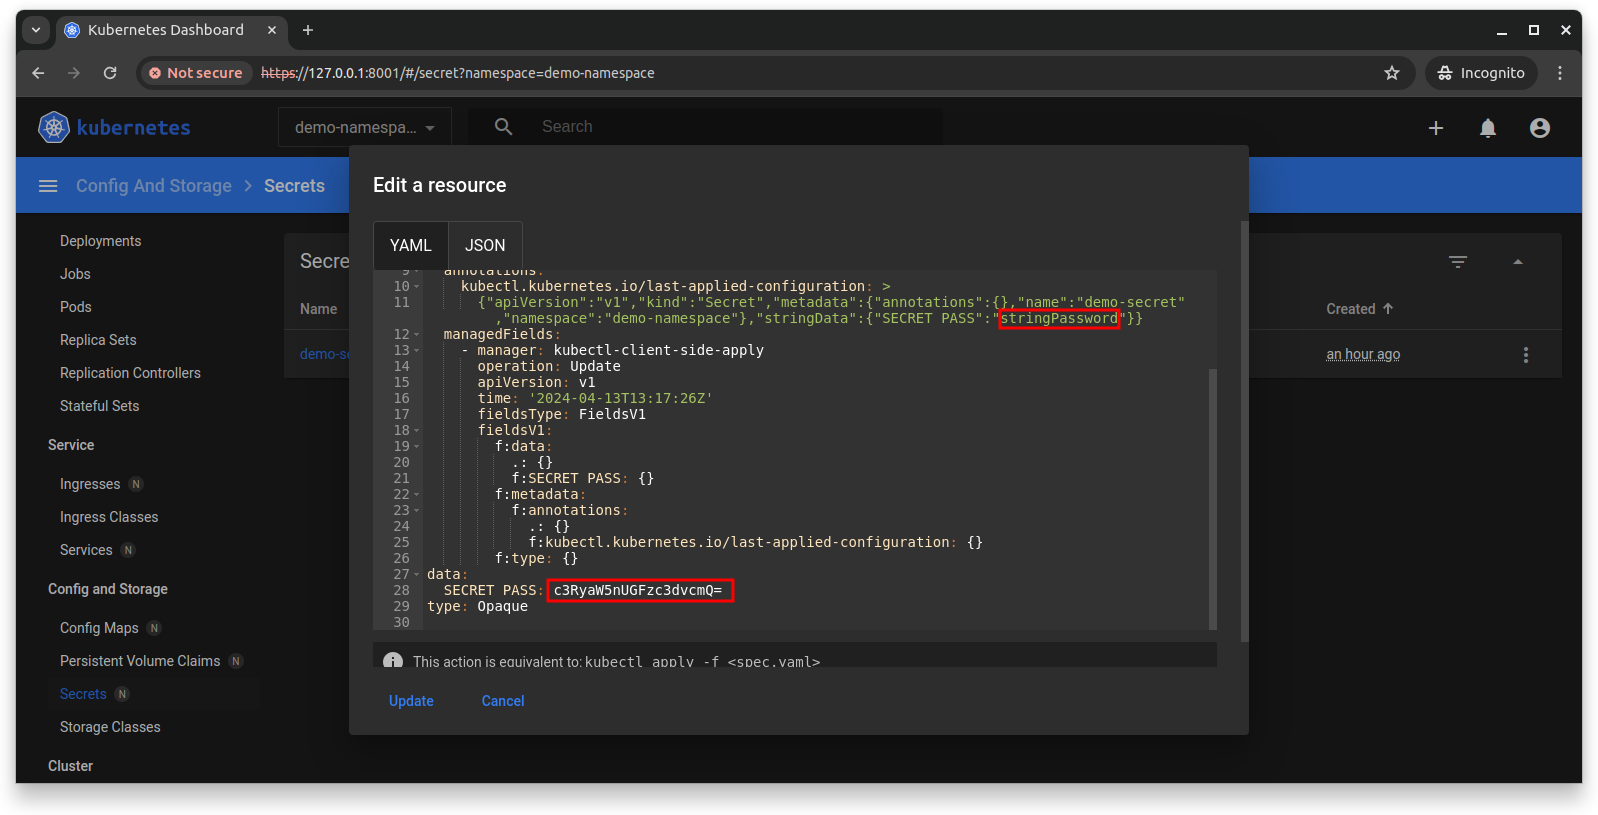
The secret is stored as Base64 at the end of the resource configuration, but it also appears in plain text in the “annotations” field. It is strongly recommended to use secrets that are encrypted or encoded, with the application handling decoding at runtime.
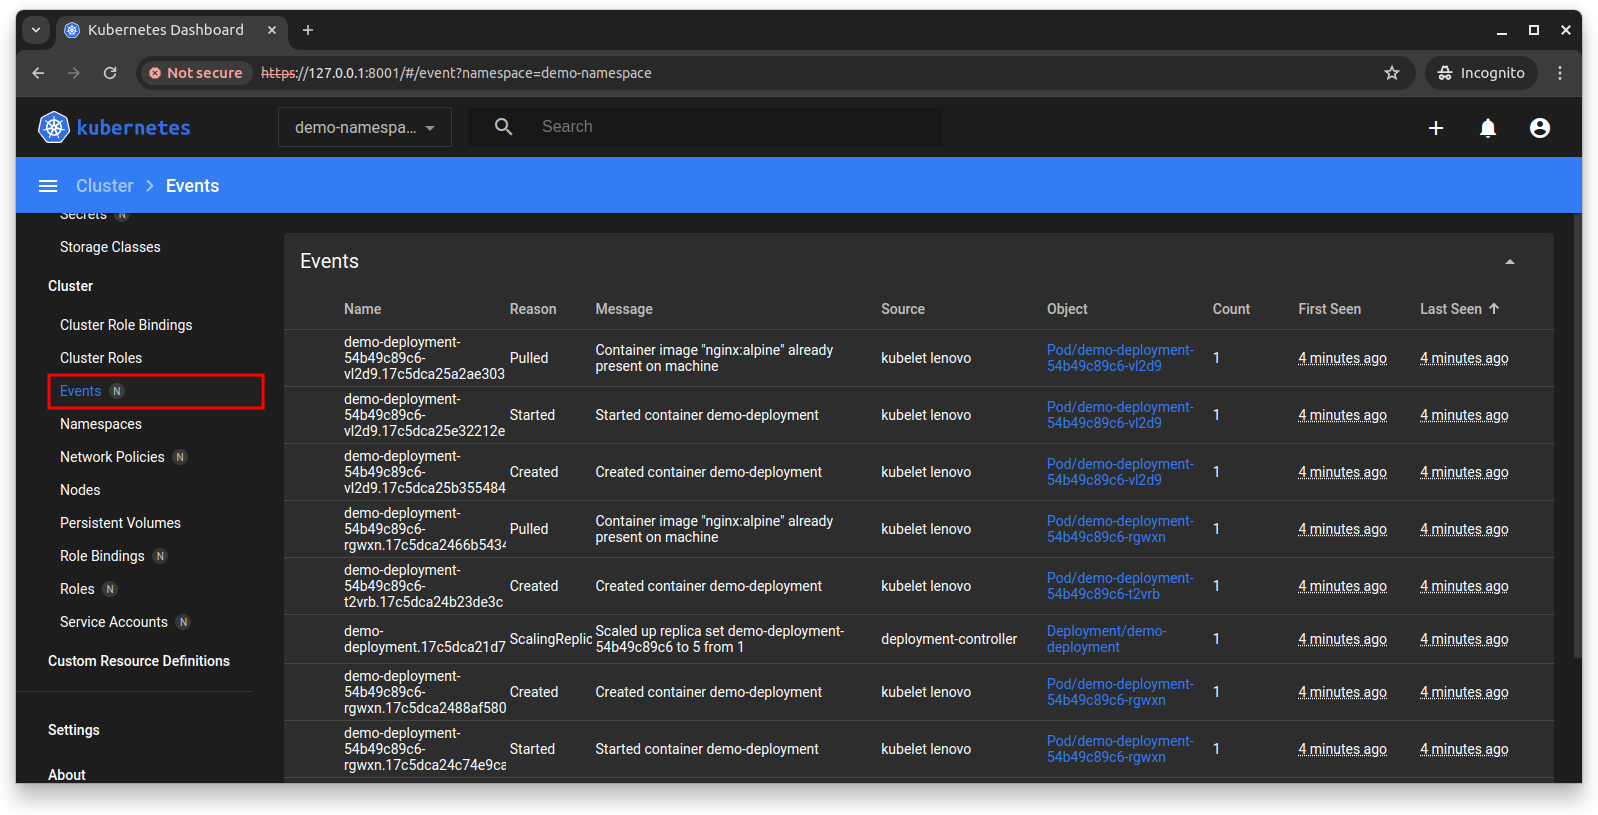
In the Cluster section, under Events, there is a log of every action applied to resources.
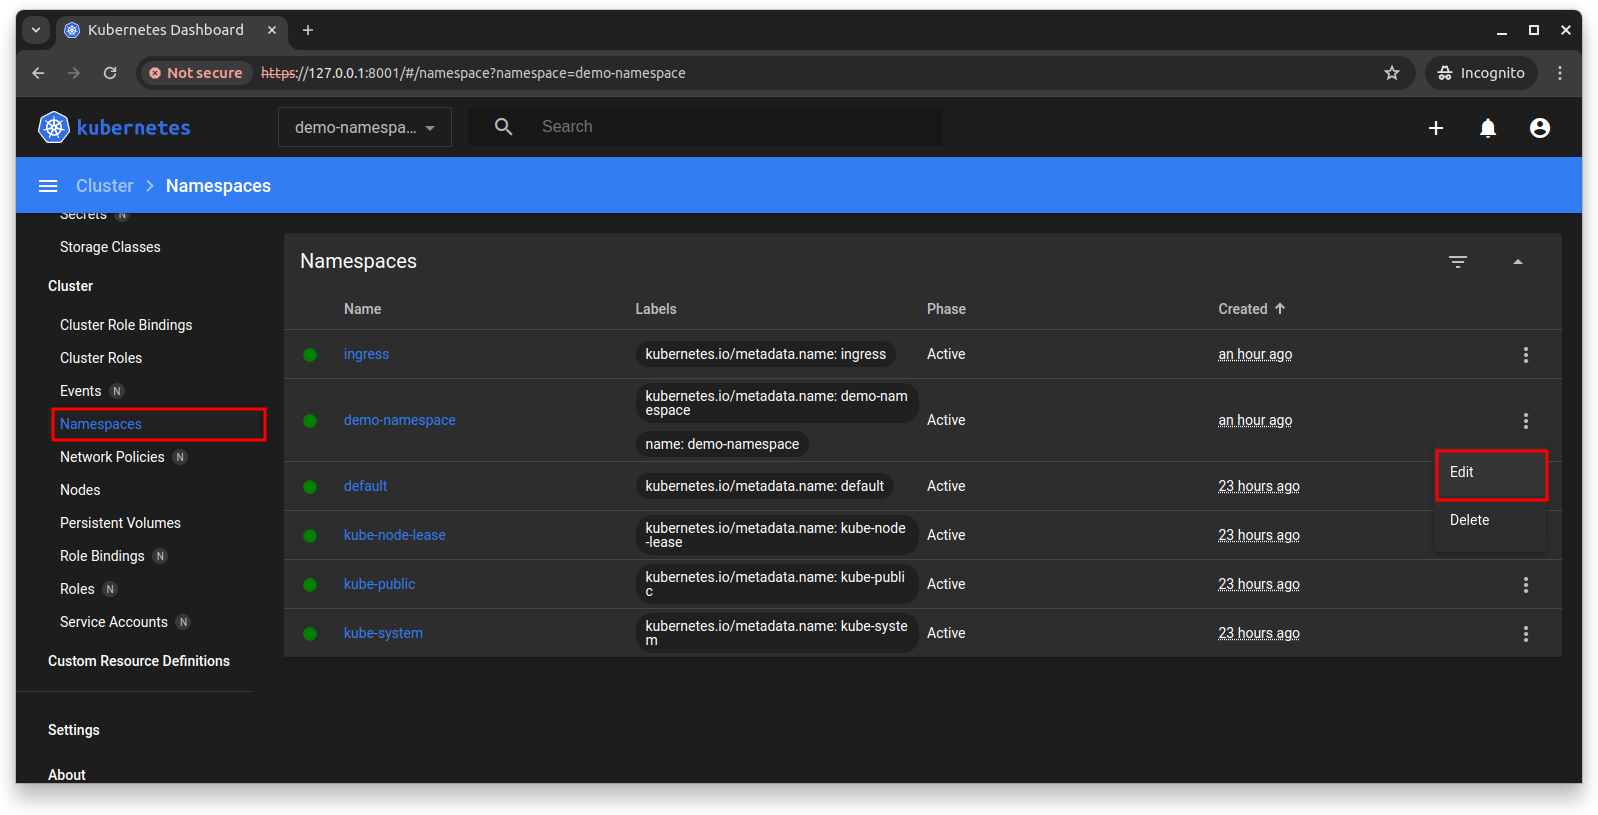
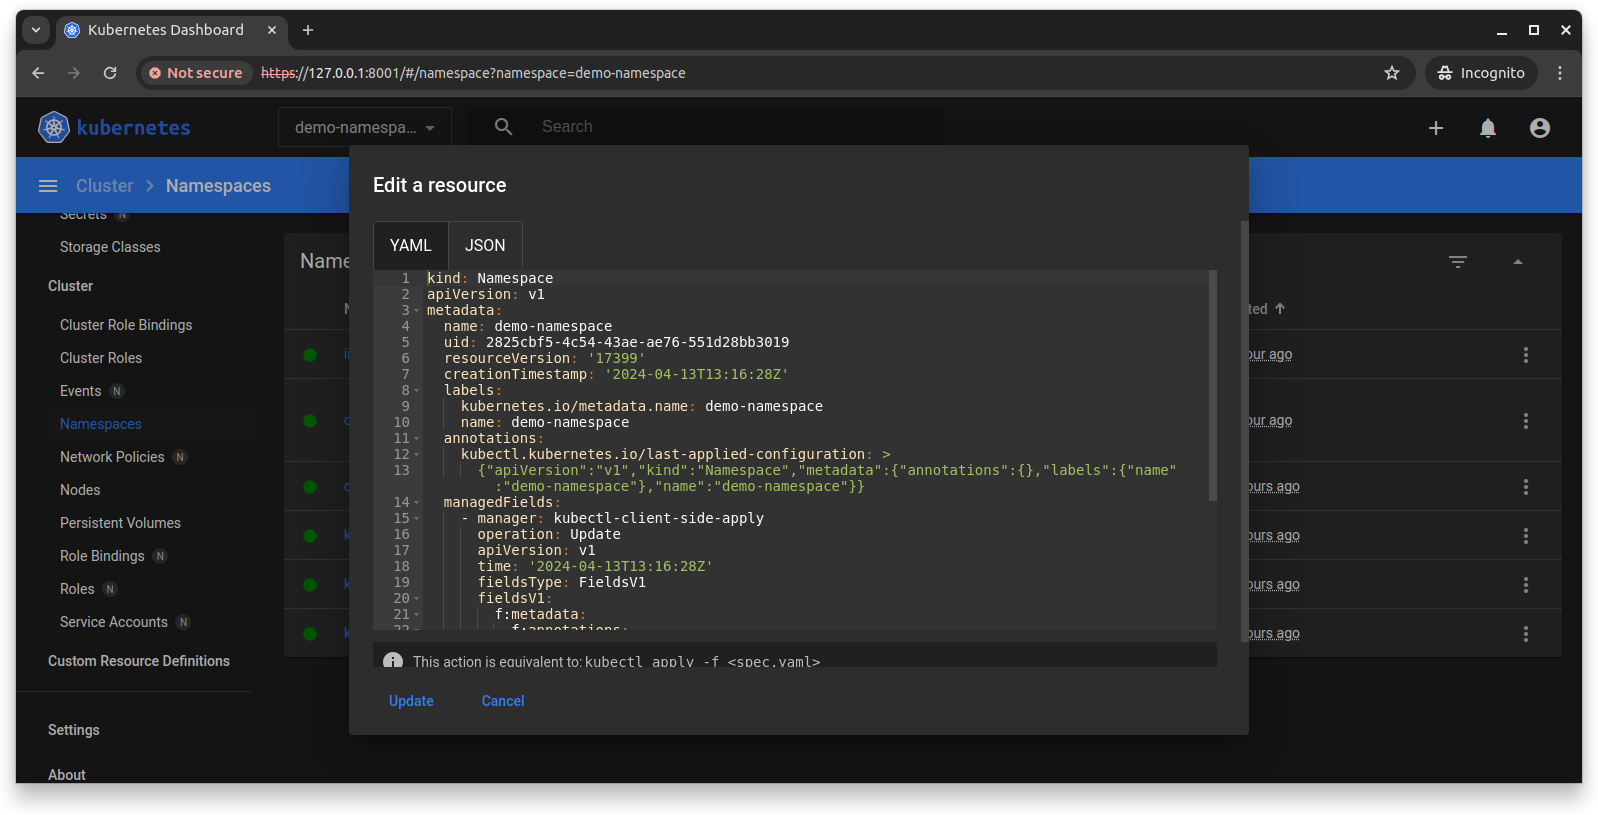
Under Namespaces, namespaces can be modified to better organize project resources and maintain isolation.
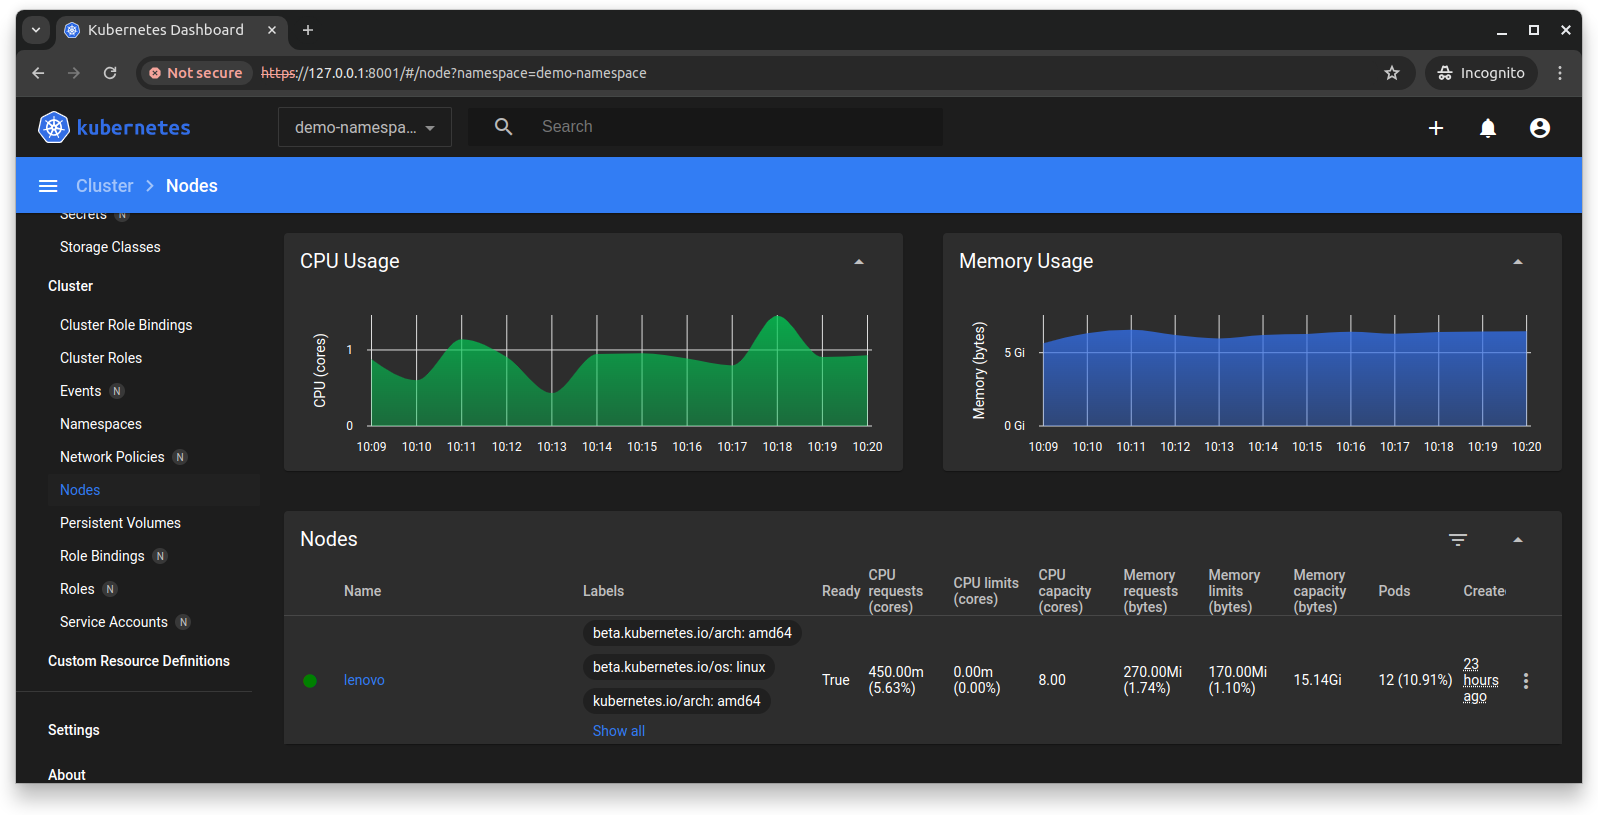
Finally, under Nodes, system metrics for the cluster nodes can be visualized.
REFLECTIONS
The Kubernetes Dashboard should never be directly exposed to the internet or left continuously running. It is a convenient tool for a visual overview of deployed resources and for making simple configuration tweaks.
The proper way to manage Kubernetes resources is through source control tools like Git, combined with a pipeline for automatic deployment of changes.
If the dashboard is needed in a production environment, use SSH tunneling to access the exposed port on the remote server’s localhost. See example:
ssh -L 8001:localhost:8001 k8s-server.com
SEE ALSO
Minikube on Ubuntu 22.04 [Link].
MicroK8s on Ubuntu 22.04 [Link].
K3s on Ubuntu 22.04 [Link].
Kubernetes Persistent Volumes [Link].
Kubernetes Cheat Sheet [Link].