Prometheus is a systems and service monitoring tool [Link]. Out of the box, it monitors the host where it is running and uses collectors such as Prometheus Node Exporter [Link] to scrape metrics from other endpoints.
Grafana is a visualization tool that consumes metrics from data sources like Prometheus to build graphs and dashboards [Link].
INSTALLING PROMETHEUS
Some will say you should not use the distribution source because it is not frequently updated, but it is the most reliable option and will upgrade and patch with the system:
sudo apt-get install prometheus prometheus-node-exporter prometheus-pushgateway prometheus-alertmanager -y
sudo systemctl stop prometheus
Enable the API to unlock additional features:
sudo nano /etc/systemd/system/multi-user.target.wants/prometheus.service
Edit the following line:
ExecStart=/usr/bin/prometheus --web.enable-lifecycle $ARGS
Note: the default data retention period is 15 days. To customize it, add the argument –storage.tsdb.retention.time=30d with the desired value.
Apply the change and start the service:
sudo systemctl daemon-reload
sudo systemctl start prometheus
sudo systemctl status prometheus
It can also be deployed as a Docker container (for reference):
sudo docker run --name prometheus -d -p 127.0.0.1:9090:9090 prom/prometheus
INSTALLING NODE EXPORTER ON EACH MONITORED HOST
sudo apt install prometheus-node-exporter -y
sudo systemctl start prometheus-node-exporter
sudo systemctl enable prometheus-node-exporter
sudo systemctl status prometheus-node-exporter
sudo ufw allow from 192.168.1.162 to any port 9100
Note: replace 192.168.1.162 with the IP of the server running Prometheus.
CONFIGURING PROMETHEUS TO REACH THE MONITORED HOSTS
sudo nano /etc/prometheus/prometheus.yml
Example configuration:
global:
  scrape_interval: 1s
  evaluation_interval: 1s
alerting:
  alertmanagers:
  - static_configs:
    - targets: ['192.168.1.162:9093']
scrape_configs:
  - job_name: 'prometheus'
    scrape_interval: 1s
    scrape_timeout: 1s
    static_configs:
      - targets: ['192.168.1.162:9090']
  - job_name: 'nodes'
    scrape_interval: 1s
    scrape_timeout: 1s
    static_configs:
      - targets: ['192.168.1.162:9100', '192.168.1.163:9100', '192.168.1.164:9100']
Note: using hostnames instead of IPs is recommended. You can configure name resolution in /etc/hosts.
Reload the configuration using the API:
curl -X POST http://localhost:9090/-/reload
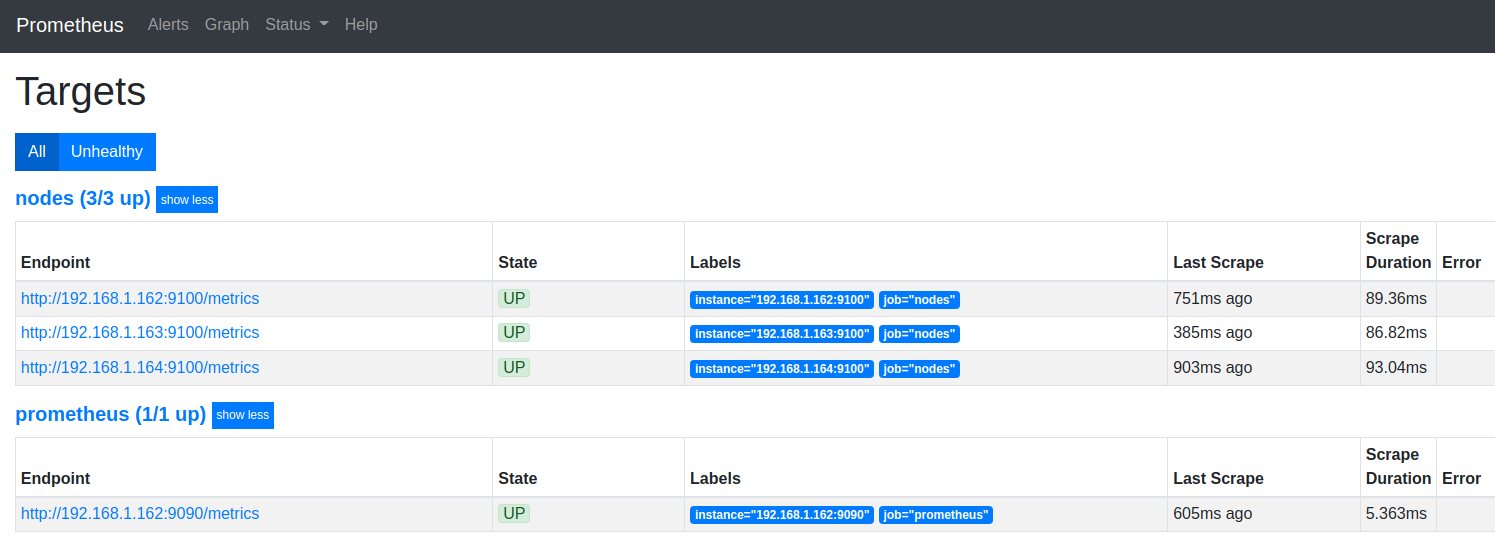
Access the Prometheus web UI at http://192.168.1.162:9090/ and navigate to Status > Targets.
INSTALLING GRAFANA
Grafana is a powerful tool for visualizing data over time. It is the most popular dashboard viewer for Prometheus, but it supports many other data sources [Link].
sudo apt-get install -y apt-transport-https
sudo apt-get install -y software-properties-common wget
curl -fsSL "https://keyserver.ubuntu.com/pks/lookup?op=get&search=0x963FA27710458545" | gpg --dearmor | sudo tee /usr/share/keyrings/repository-keyring.gpg >/dev/null
echo "deb [signed-by=/usr/share/keyrings/repository-keyring.gpg] https://apt.grafana.com stable main" | sudo tee -a /etc/apt/sources.list.d/grafana.list
sudo apt-get update
sudo apt-get install grafana -y
sudo systemctl start grafana-server
sudo systemctl enable grafana-server
sudo systemctl status grafana-server
sudo ufw allow 3000
Access the web UI at http://192.168.1.162:3000/ and change the default password (admin:admin) immediately.
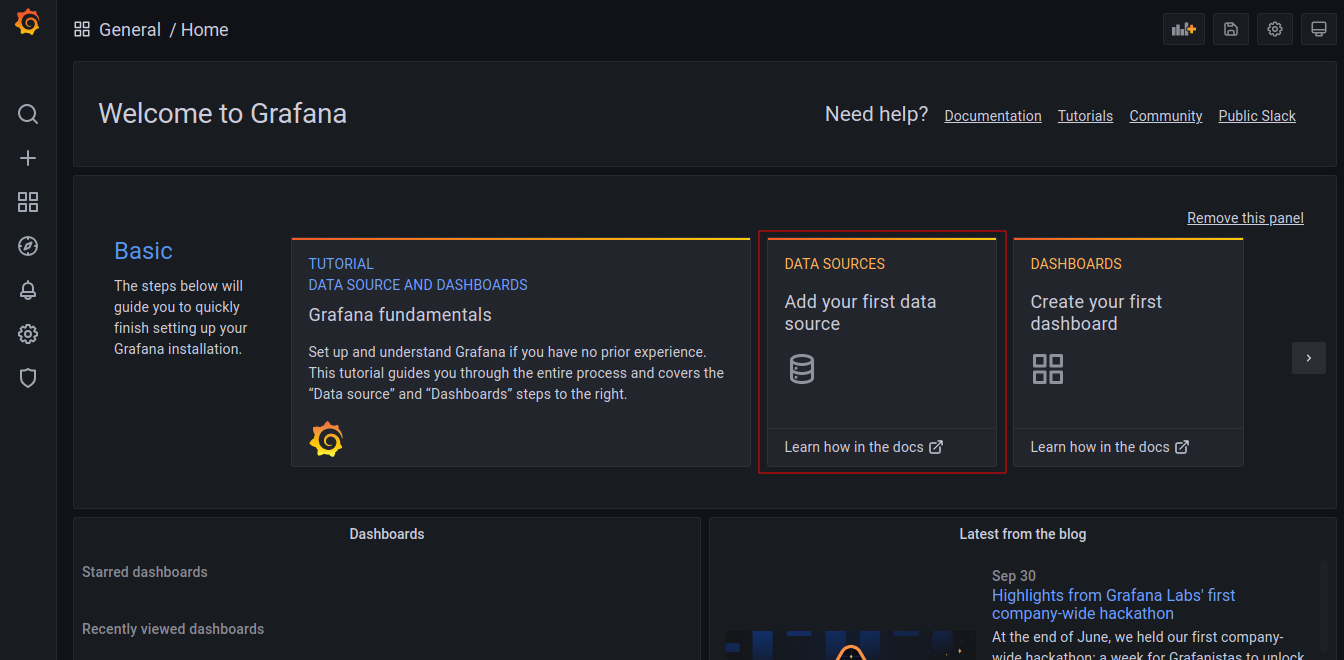
From the Home page, import a dashboard from the online repository [Link].
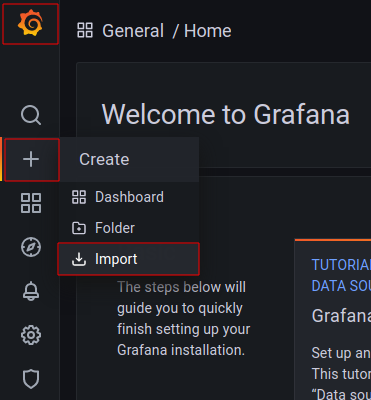
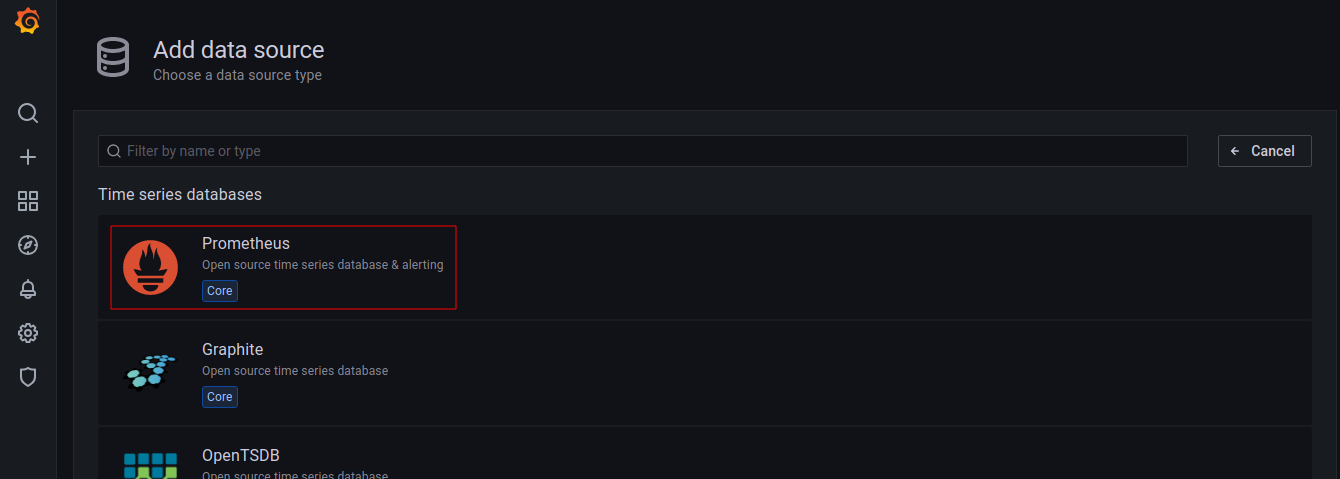
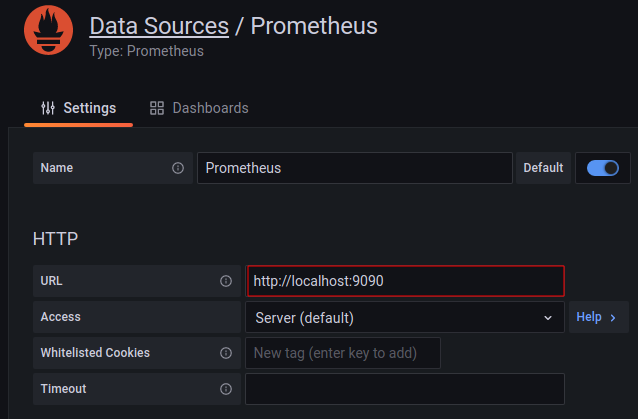
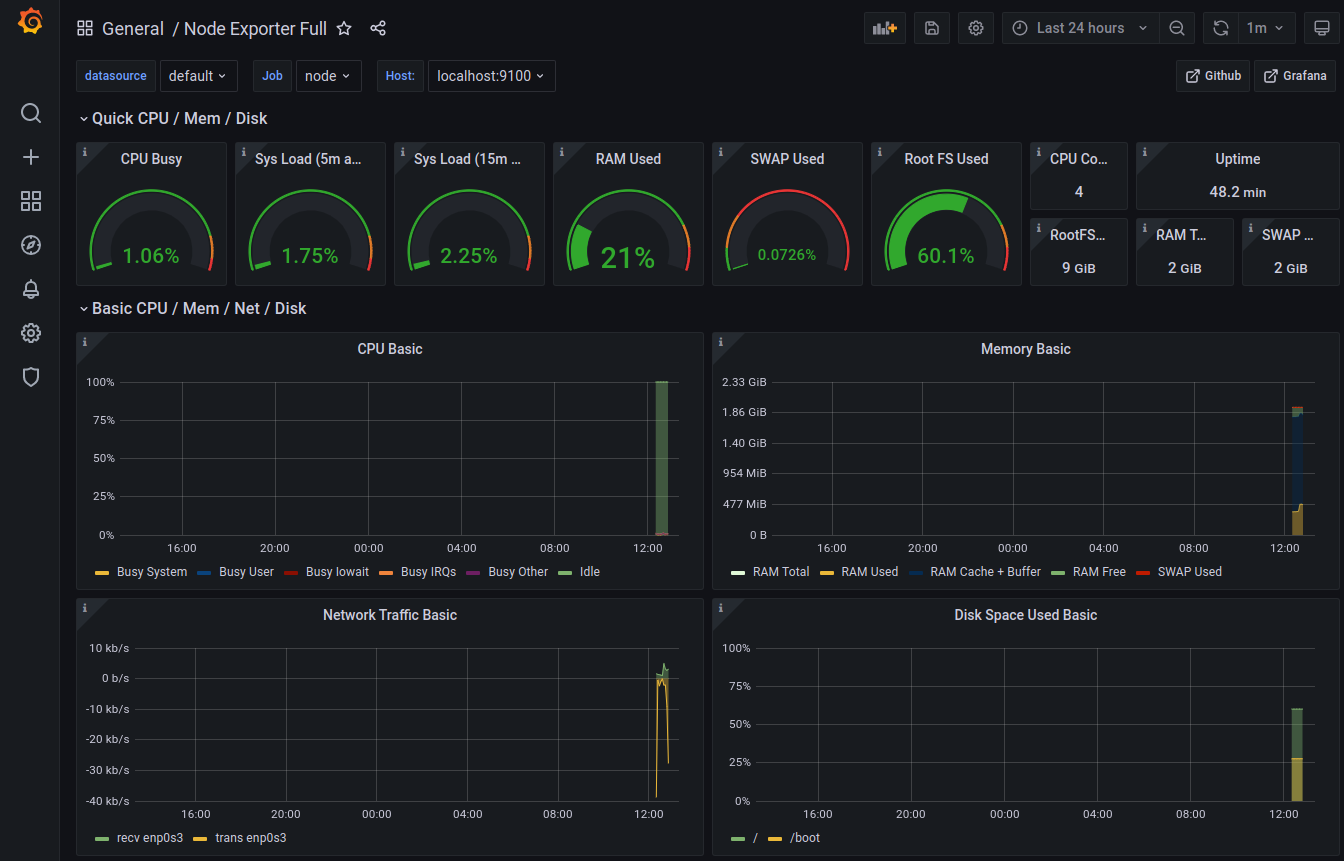
Import dashboard 1860 and select Prometheus as the data source.
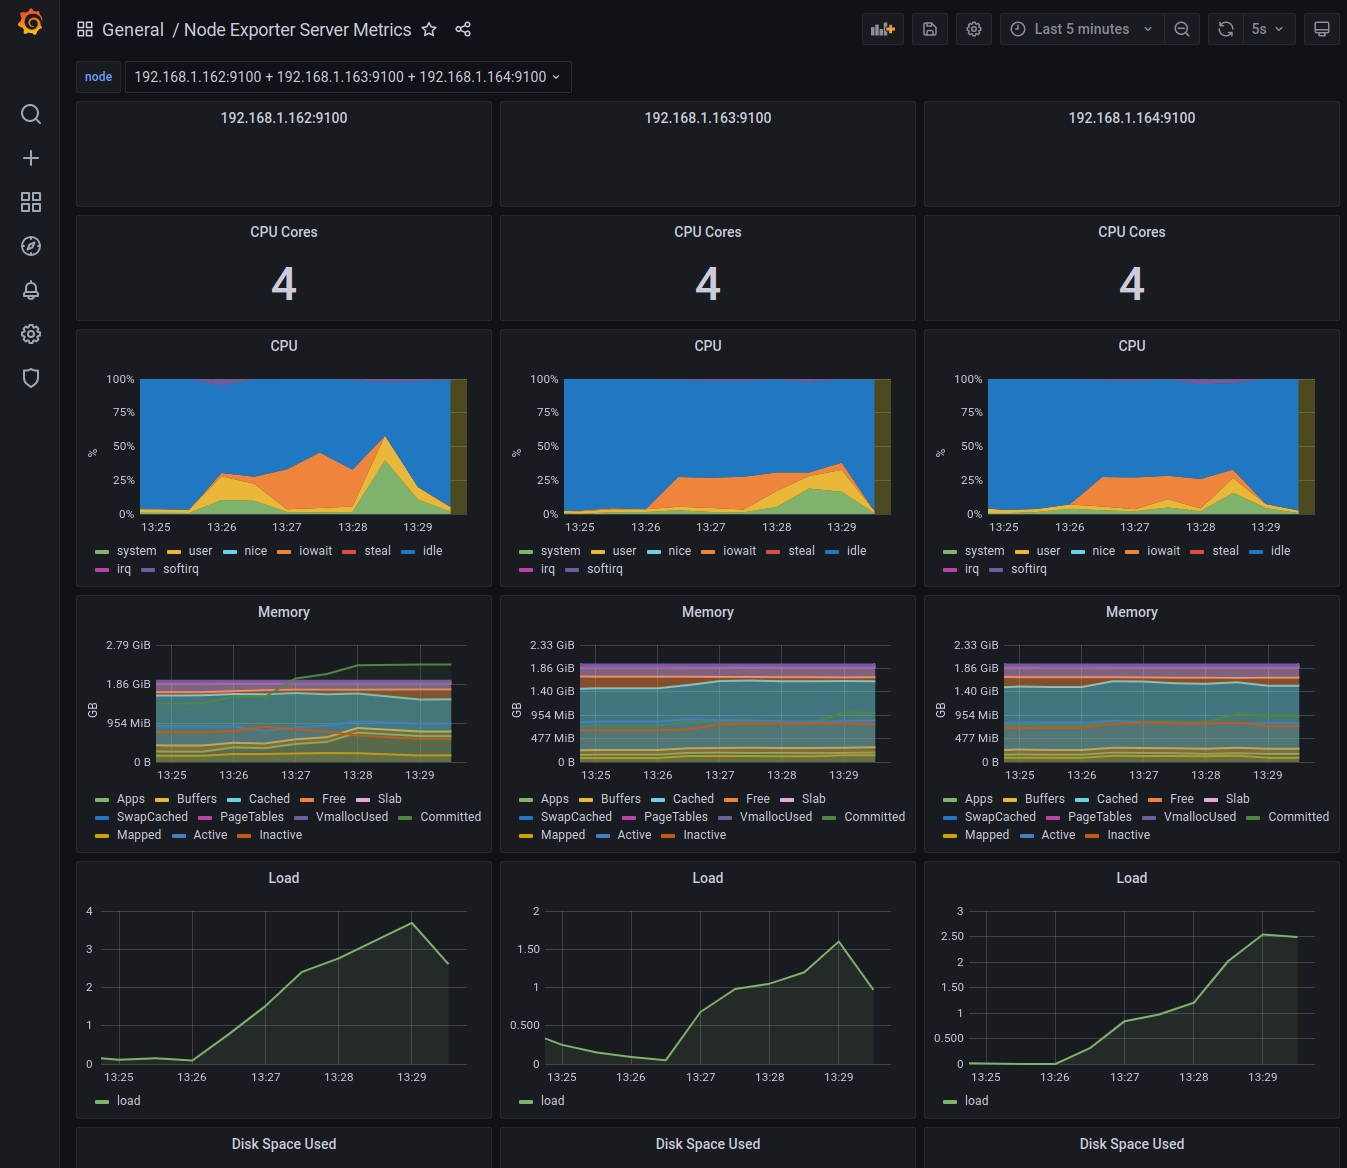
Repeat the import with dashboard 405.
Open the dashboard and customize the imported views as needed:
REFLECTION
Keep an eye on storage usage at /var/lib/prometheus/metrics2/ while you dial in the retention time and scraping frequency that best fit your needs.
For reference: my setup runs Prometheus on one server and scrapes data from two additional servers (4 sources total) every 1 second. This accumulates roughly 800 MB of data every 24 hours.
Email alerts render much better with the image renderer plugin:
sudo grafana-cli plugins install grafana-image-renderer
SMTP settings can be configured in:
sudo nano /etc/grafana/grafana.ini
Always restart Grafana after making configuration changes or installing plugins:
sudo systemctl restart grafana-server
To use AWS CloudWatch as a Grafana data source, follow these steps and adjust as needed:
IAM > Policies > Add service: CloudWatch > Allow for: ListMetrics, GetMetricData, GetMetricStatistics.
IAM > Roles > AWS Service > EC2 > Select the Policy to the Role.
IAM > Users > Add User > Attach Existent Policy > Select the Policy to the User > Get AccessKey and SecretKey.
EC2 > Select the Instance > Actions > Instance Settings > Attach/Replace IAM Role.
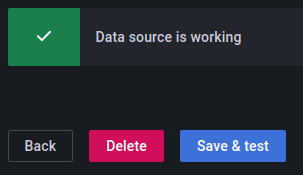
Then use the AccessKey and SecretKey to add CloudWatch as a data source in the Grafana web UI.
BONUS
For monitoring Databases, use Percona Monitoring and Management (PMM) [Link].
Server
curl -fsSL https://www.percona.com/get/pmm | /bin/bash
Client
wget https://repo.percona.com/apt/percona-release_latest.$(lsb_release -sc)_all.deb
sudo dpkg -i percona-release_latest.$(lsb_release -sc)_all.deb
sudo apt-get update
sudo apt-get install pmm2-client
Connect the client to the server:
sudo pmm-admin config --server-insecure-tls --server-url=https://admin:strong_password@pmm-server.local
Create a database account for metrics collection (example for MySQL 8):
CREATE USER 'pmm'@'localhost' IDENTIFIED BY 'strong_password' WITH MAX_USER_CONNECTIONS 10;
GRANT SELECT, PROCESS, SUPER, REPLICATION CLIENT, RELOAD, BACKUP_ADMIN ON *.* TO 'pmm'@'localhost';
BONUS OF THE BONUS
For monitoring the uptime of services such as HTTP(S), DNS, Ping, and TCP, check out Uptime Kuma [Link].
Docker Compose Deployment
apt update && apt-get upgrade -y
apt install docker.io docker-compose -y
mkdir uptime-kuma && cd uptime-kuma
curl -o compose.yaml https://raw.githubusercontent.com/louislam/uptime-kuma/master/compose.yaml
docker-compose up -d
Docker Deployment (the lazy way)
sudo docker run -d --restart=always --network=host -v uptime-kuma:/app/data --name uptime-kuma louislam/uptime-kuma:base3
Ubuntu Installation
git clone https://github.com/louislam/uptime-kuma.git
cd uptime-kuma
sudo apt install npm -y
sudo npm run setup
sudo npm install pm2 -g && sudo pm2 install pm2-logrotate
sudo pm2 start server/server.js --name uptime-kuma
sudo pm2 save && sudo pm2 startup
To run it behind a reverse proxy with TLS termination and automated Let’s Encrypt certificates:
sudo apt install nginx certbot python3-certbot-nginx -y
sudo nano /etc/nginx/sites-enabled/default
server {
   listen 80 default_server;
   listen [::]:80 default_server;
   root /var/www/html;
   index index.html;
   server_name _;
   location / {
      proxy_pass http://127.0.0.1:3001;
      proxy_set_header Host $host;
   }
}
sudo nginx -t && sudo nginx -s reload
sudo certbot --nginx --non-interactive --agree-tos --redirect --email [email protected] -d uptime.domain.com
If you need to monitor an external or public service to detect outages affecting your monitoring, check out Status Shield [Link].
MOREOVER
For monitoring cron jobs or background tasks that could silently fail, try healthchecks.io [Link].
The following docker-compose.yaml handles the full deployment and configuration:
version: "3"
services:
  healthchecks:
    image: healthchecks/healthchecks:latest
    container_name: healthchecks
    environment:
      - DB=sqlite
      - DB_NAME=/data/hc.sqlite
      - DEBUG=False
      - [email protected]
      - EMAIL_HOST=smtp.example.com
      - [email protected]
      - EMAIL_HOST_PASSWORD=strong_password

###### For STARTTLS - Explicit TLS
      - EMAIL_PORT=587
      - EMAIL_USE_TLS=True

###### For SMTPS - Implicit TLS (deprecated)
#      - EMAIL_PORT=465
#      - EMAIL_USE_TLS=False
#      - EMAIL_USE_SSL=True

      - SECRET_KEY=f7993db8-1004-414b-be03-ad4a5d5153a3
      - ALLOWED_HOSTS=healthchecks.simnet.cloud
      - SITE_ROOT=https://healthchecks.simnet.cloud/
      - REGISTRATION_OPEN=False
    ports:
      - 8000:8000
    volumes:
      - healthchecks-data:/data
    restart: unless-stopped
volumes:
    healthchecks-data:
It is also recommended to run it behind a reverse proxy with TLS termination.
See also Grafana Alloy and Grafana Loki for combining logs with metrics and exploring them in Grafana dashboards.