What is Elastic Stack or ELK?
- Elasticsearch
- A distributed search and analytics engine, essentially a big-data database. Elasticsearch is the central component of the Elastic Stack [Link].
- Logstash
- Not a mandatory component, but essential when data needs to be transformed during ingestion from multiple sources on the server side. Beats agents can also send data directly to Elasticsearch if no transformation is needed [Link].
- Kibana
- The frontend (dashboard) used to search, index, and visualize data. It sits on top of the Elastic Stack [Link].
On the client side, an Elastic Agent collects data based on Policies (groups of Integrations) that can be managed from a single point: the ELK server.
Beats [Link] are open source data shipper agents that send operational data to Elasticsearch. They can be manually installed or managed via the Elastic Agent.
What is each Beat used for?
- Auditbeat
- Audits Linux data for file integrity.
- Filebeat
- Tails log files and journals.
- Functionbeat
- Cloud data shipper for serverless applications.
- Heartbeat
- Checks availability by pinging remote services.
- Metricbeat
- Scrapes metrics from systems and services.
- Packetbeat
- Sniffs network traffic to monitor applications.
- Winlogbeat
- Ships Windows event logs.
- Osquerybeat
- Runs Osquery, a SQL-powered framework for OS instrumentation, monitoring, and analytics.
What are the requirements for an Elastic Stack server?
- 16 GB of RAM
- 4 vCPU
- 20 GB for the system
- After installation, about 10 GB will be used.
- 50 GB for data storage (ideally on a secondary volume)
- This is a starting point; actual needs depend on data volume.
PRE-INSTALLATION
For Debian-based distributions, such as Ubuntu:
sudo apt update
sudo apt upgrade -y
sudo hostnamectl set-hostname elk
sudo reboot
INSTALLING ELASTICSEARCH
On the server:
wget -qO - https://artifacts.elastic.co/GPG-KEY-elasticsearch | sudo apt-key add -
sudo apt install apt-transport-https -y
echo "deb https://artifacts.elastic.co/packages/8.x/apt stable main" | sudo tee -a /etc/apt/sources.list.d/elastic-8.x.list
sudo apt update && sudo apt install elasticsearch -y
Note the output at the end of the installation (see example below):
--------------------------- Security autoconfiguration information ------------------------------

Authentication and authorization are enabled.
TLS for the transport and HTTP layers is enabled and configured.

The generated password for the elastic built-in superuser is : 4T3lx5OhuhY1kUm4jUc+

If this node should join an existing cluster, you can reconfigure this with
'/usr/share/elasticsearch/bin/elasticsearch-reconfigure-node --enrollment-token'
after creating an enrollment token on your existing cluster.

You can complete the following actions at any time:

Reset the password of the elastic built-in superuser with
'/usr/share/elasticsearch/bin/elasticsearch-reset-password -u elastic'.

Generate an enrollment token for Kibana instances with
'/usr/share/elasticsearch/bin/elasticsearch-create-enrollment-token -s kibana'.

Generate an enrollment token for Elasticsearch nodes with
'/usr/share/elasticsearch/bin/elasticsearch-create-enrollment-token -s node'.

-------------------------------------------------------------------------------------------------
Note: the superuser account above has the username elastic and, in this example, the password is 4T3lx5OhuhY1kUm4jUc+.
sudo nano /etc/elasticsearch/elasticsearch.yml
Edit or add the following lines:
network.host: 0.0.0.0
discovery.seed_hosts: [ ]
Start the service:
sudo systemctl enable elasticsearch
sudo systemctl start elasticsearch
sudo systemctl status elasticsearch
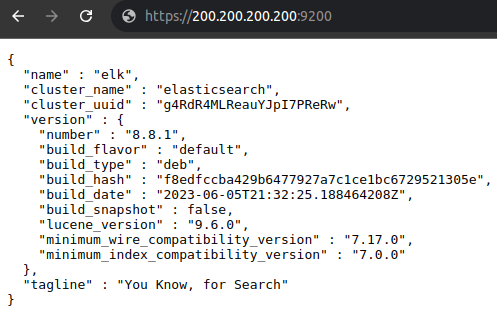
Navigate to https://200.200.200.200:9200 (replace the IP with the correct one):
Check the logs if needed:
sudo tail /var/log/elasticsearch/elasticsearch.log
INSTALLING KIBANA
On the same server:
sudo apt install kibana -y
sudo nano /etc/kibana/kibana.yml
server.host: "0.0.0.0"
server.name: "ELK"
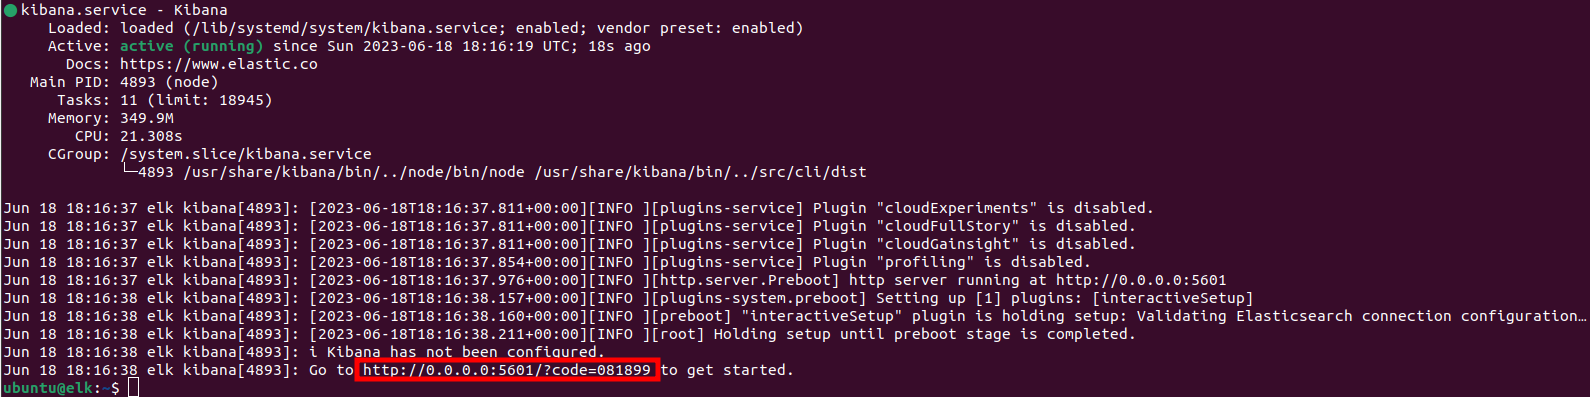
sudo systemctl enable kibana
sudo systemctl start kibana
sudo systemctl status kibana
sudo /usr/share/elasticsearch/bin/elasticsearch-create-enrollment-token -s kibana

Navigate to http://200.200.200.200:5601/?code=081899 (replace the IP with the correct one):
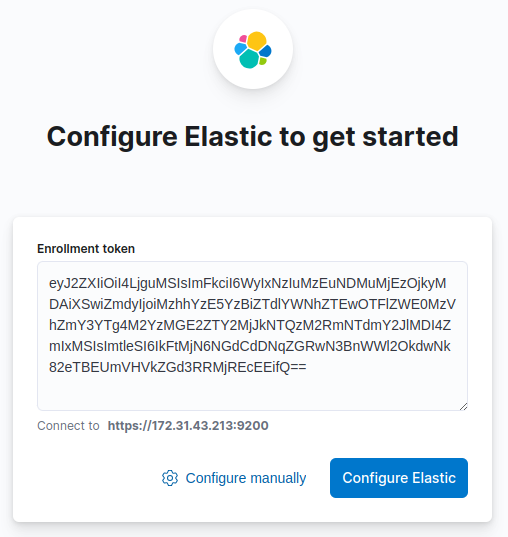
Note: this token is the one generated in the previous command. If prompted for a Verification Code (a 6-digit OTP), run:
/usr/share/kibana/bin/kibana-verification-code
Check the logs if needed:
sudo tail /var/log/kibana/kibana.log
INSTALLING LOGSTASH (OPTIONAL)
Logstash can modify data before ingestion (e.g. converting logs from a proprietary format to a generic one).
sudo apt install logstash -y
sudo systemctl enable logstash
sudo systemctl start logstash
sudo systemctl status logstash
ADDING A FLEET SERVER (OPTIONAL)
Fleet Server allows monitoring of system metrics from a fleet of servers (e.g. Windows or Linux servers).
curl -L -O https://artifacts.elastic.co/downloads/beats/elastic-agent/elastic-agent-8.8.1-amd64.deb
sudo dpkg -i elastic-agent-8.8.1-amd64.deb
sudo elastic-agent enroll --insecure --url=https://172.31.43.213:8220 --enrollment-token=V0czdno0Z0J0M2pkZHA3cGM1YVQ6Wk9aZE1fZEtUQm1PQW5MY2VkN2xOZw==
sudo systemctl enable elastic-agent
sudo systemctl start elastic-agent
sudo systemctl status elastic-agent
Note: the steps above were provided by Kibana when adding the Fleet Server. The --insecure argument was added because no CA (Certificate Authority) was set up in this lab.
POST-INSTALLATION
Set firewall rules accordingly. Basic example for a Debian-based distribution such as Ubuntu 22.04 LTS:
sudo ufw limit 22 comment "SSH"
sudo ufw allow 9200 comment "Elasticsearch"
sudo ufw allow 5601 comment "Kibana"
sudo ufw allow 8220 comment "Fleet Server"
sudo ufw allow 5044 comment "Logstash"
sudo ufw enable
sudo ufw status numbered
Note: if this server has a public IP, these services will be exposed to the internet. It is recommended to keep the server accessible only on the local (internal) network. A reverse proxy is a good option for making it publicly available while also handling SSL/TLS certificates.
INSTALLING FILEBEAT
Filebeat [Link] is the most versatile of all Beats. It works like the tail -f command, watching log files for new entries and forwarding events to Elasticsearch.
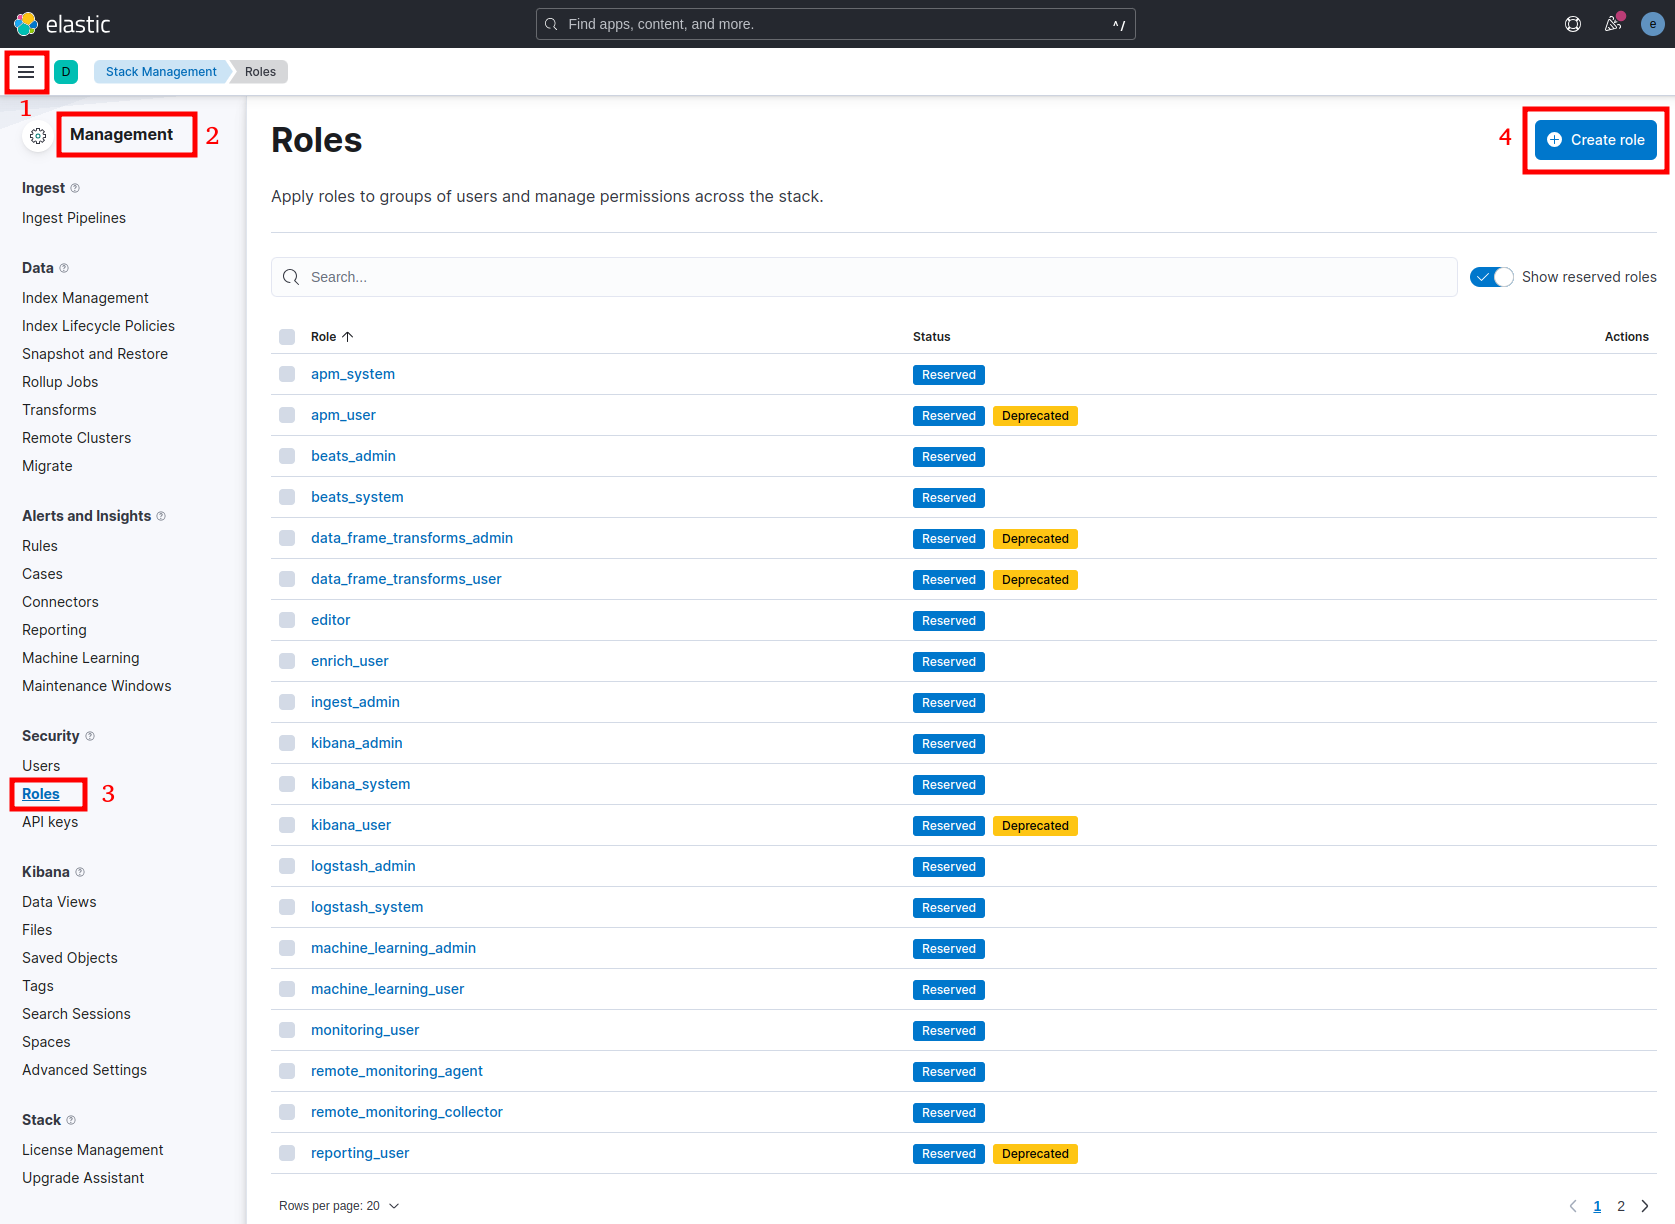
Create a Role to grant the Filebeat Agent the necessary privileges. Navigate to Management > Stack Management > Security > Roles > Create role:
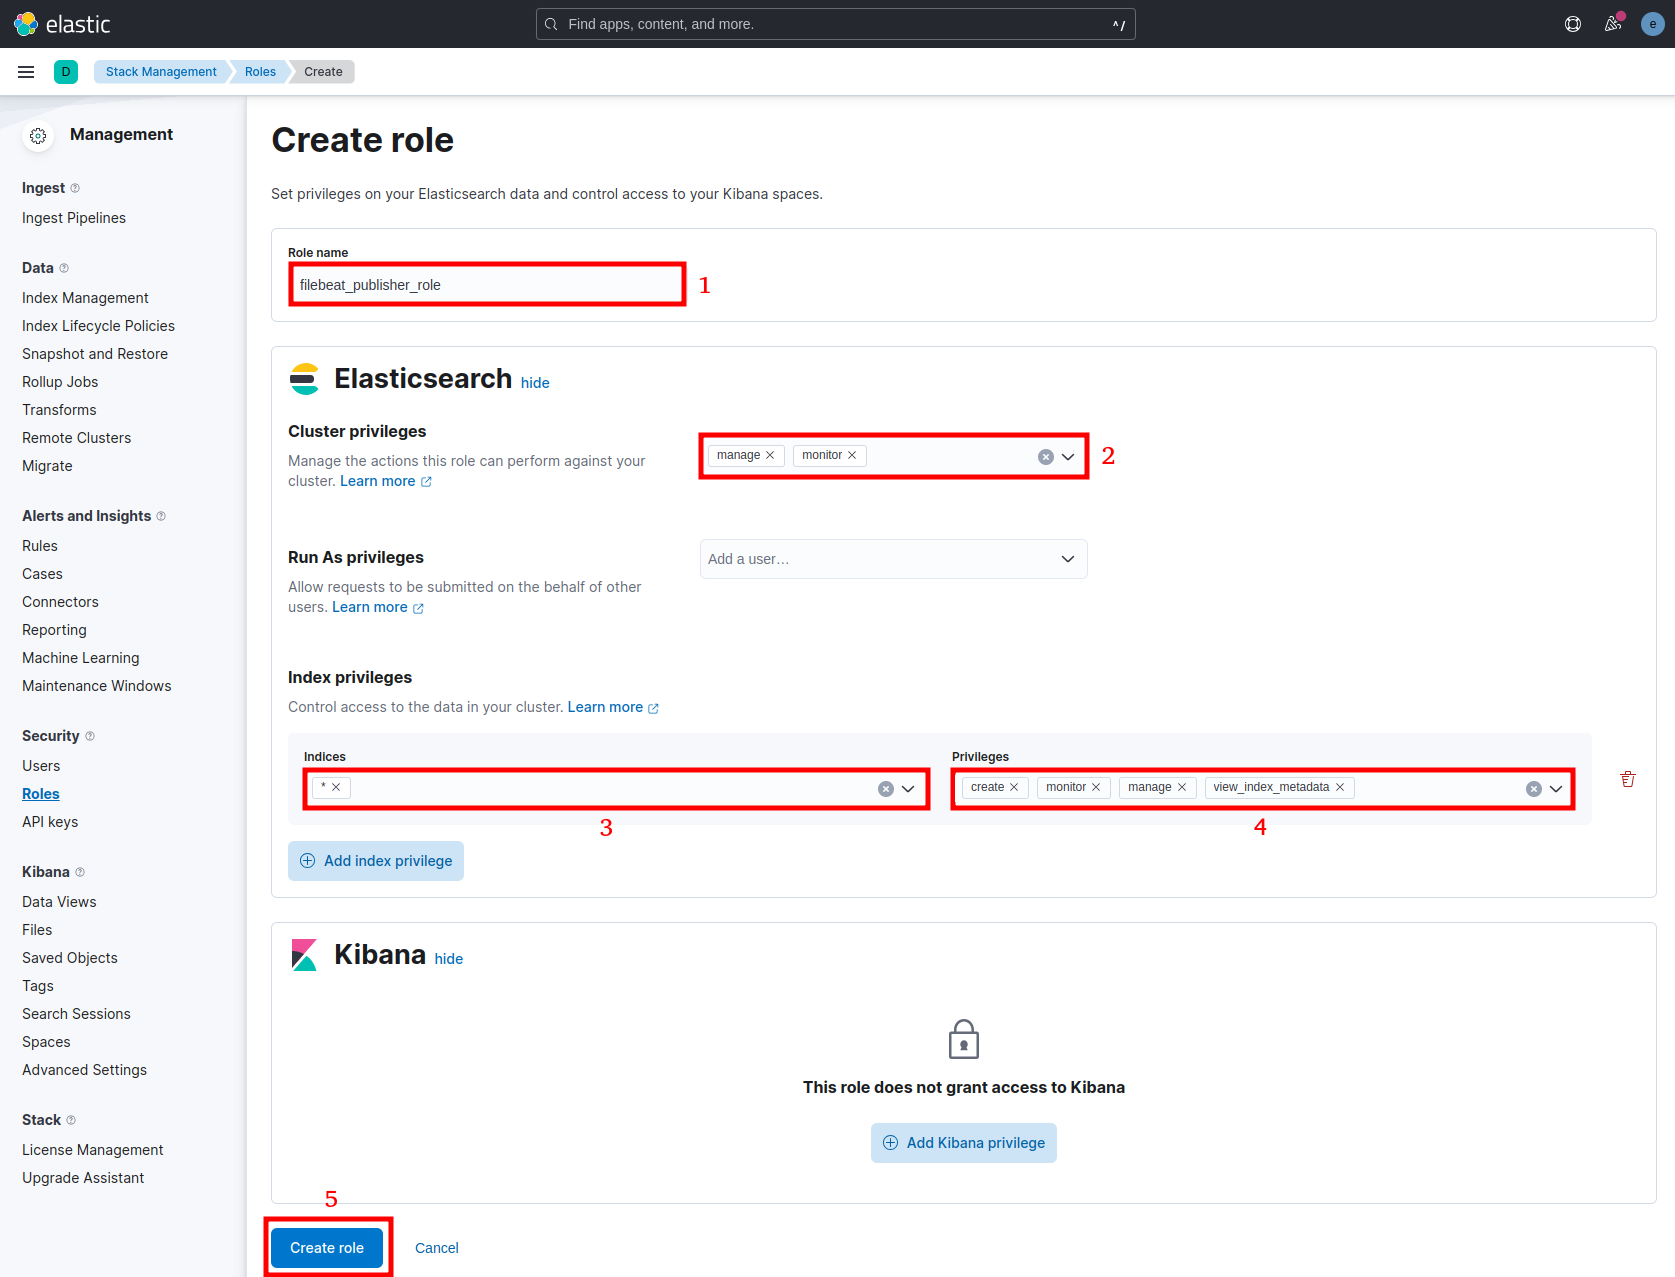
- Role name: filebeat_publisher_role
- Cluster privilege: manage, monitor
- Indices: *
- Privileges: create, monitor, manage, view_index_metadata
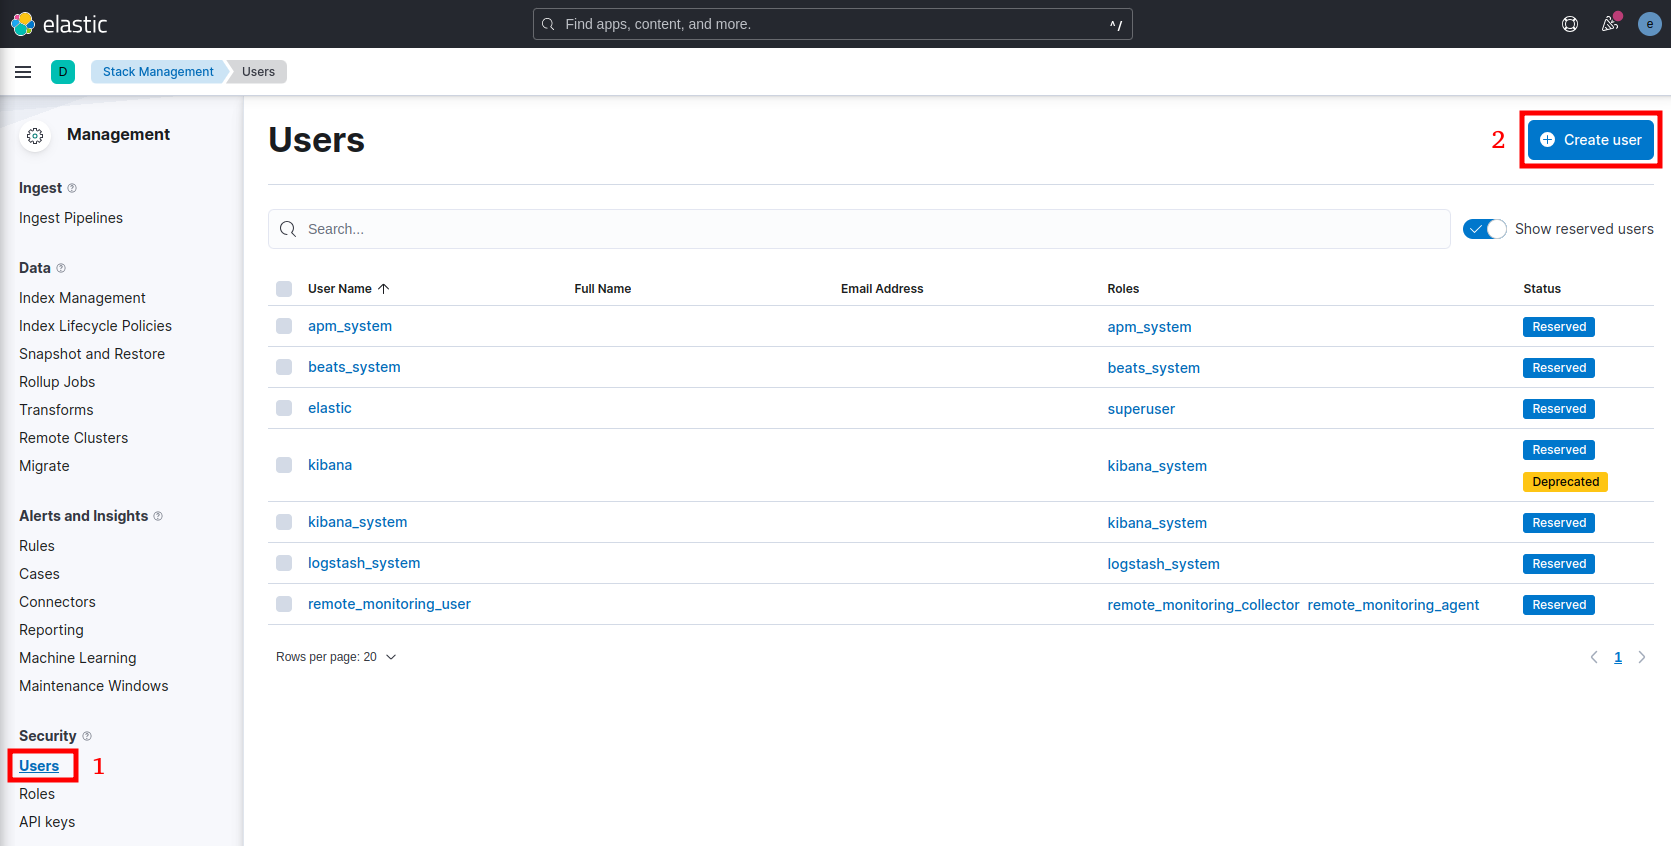
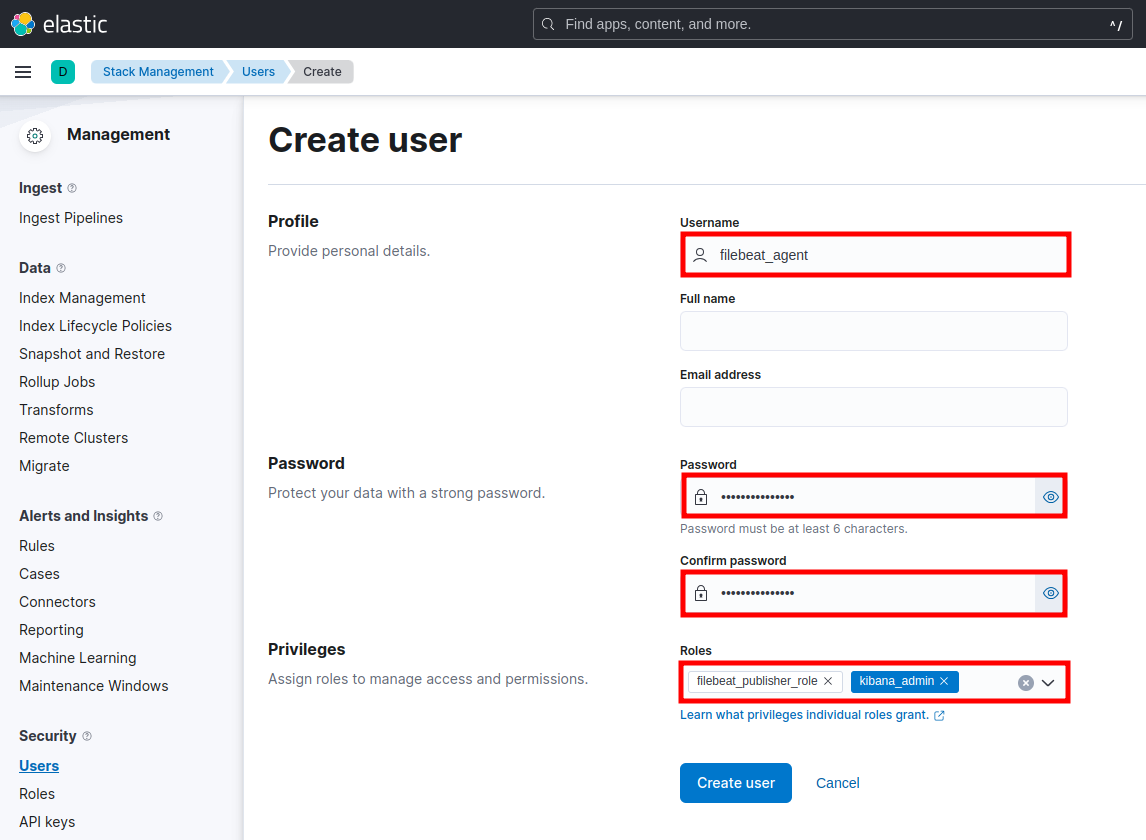
Then create a User for the Filebeat Agent. Navigate to Management > Stack Management > Security > Users > Create user:
- Username: filebeats_agent
- Password: *************
- Confirm password: *************
- Roles: filebeats_publisher_role, kibana_admin
On a Debian-based client, such as Ubuntu 22.04 LTS:
wget -qO - https://artifacts.elastic.co/GPG-KEY-elasticsearch | sudo apt-key add -
sudo apt install apt-transport-https -y
echo "deb https://artifacts.elastic.co/packages/8.x/apt stable main" | sudo tee -a /etc/apt/sources.list.d/elastic-8.x.list
sudo apt update && sudo apt install filebeat -y
sudo nano /etc/filebeat/filebeat.yml
Edit or add the following configuration:
# ============================== Filebeat inputs ===============================
filebeat.inputs:
  - type: filestream
    id: application1
    enabled: true
    paths:
      - /var/log/application1/*.log
    fields:
      level: debug
      env: prod
# =================================== Kibana ===================================
setup.kibana:
  host: "http://192.168.1.200:5601"
  username: "filebeat_agent"
  password: "8NGwMnM46YvbRbV"
# ================================== Outputs ===================================
output.elasticsearch:
  hosts: ["192.168.1.200:9200"]
  protocol: "https"
  username: "filebeat_agent"
  password: "8NGwMnM46YvbRbV"
  ssl:
    enabled: true
    verification_mode: none
Create the test log file:
sudo mkdir /var/log/application1
sudo chown ubuntu: /var/log/application1
echo "Current time " `date` >> /var/log/application1/info.log
echo "Current time " `date` >> /var/log/application1/warning.log
echo "Current time " `date` >> /var/log/application1/error.log
sudo filebeat setup test -e
If there are no errors, start the service:
sudo filebeat setup -e
sudo systemctl enable filebeat
sudo systemctl start filebeat
sudo systemctl status filebeat
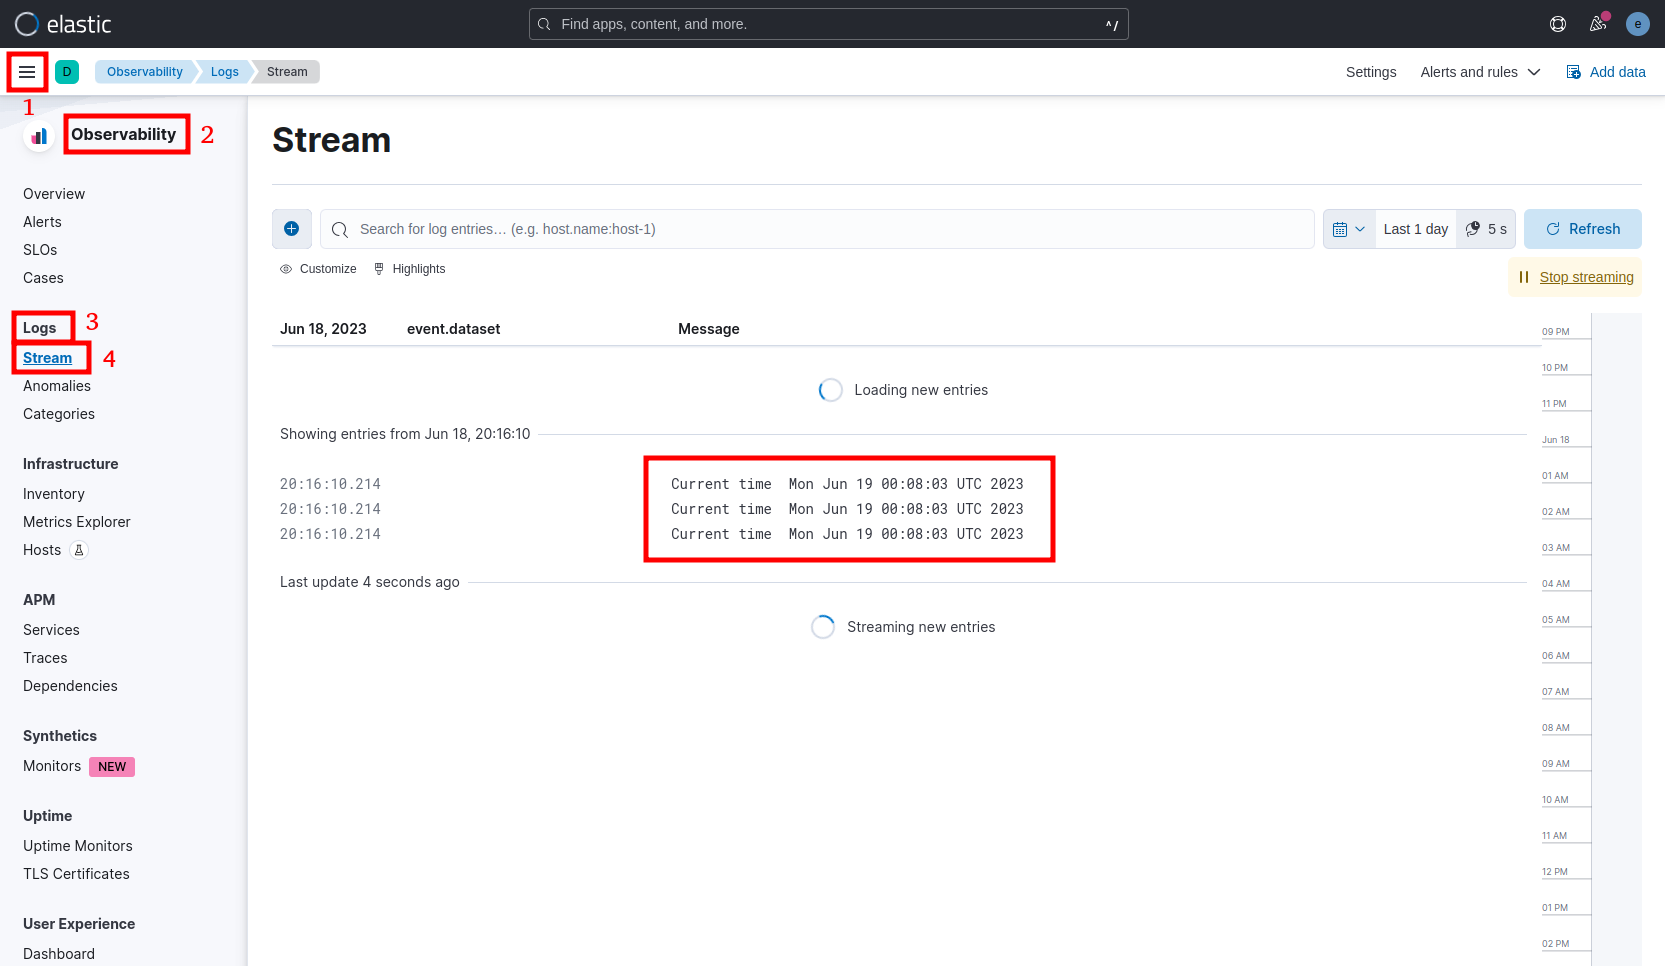
Navigate to Observability > Logs > Stream: