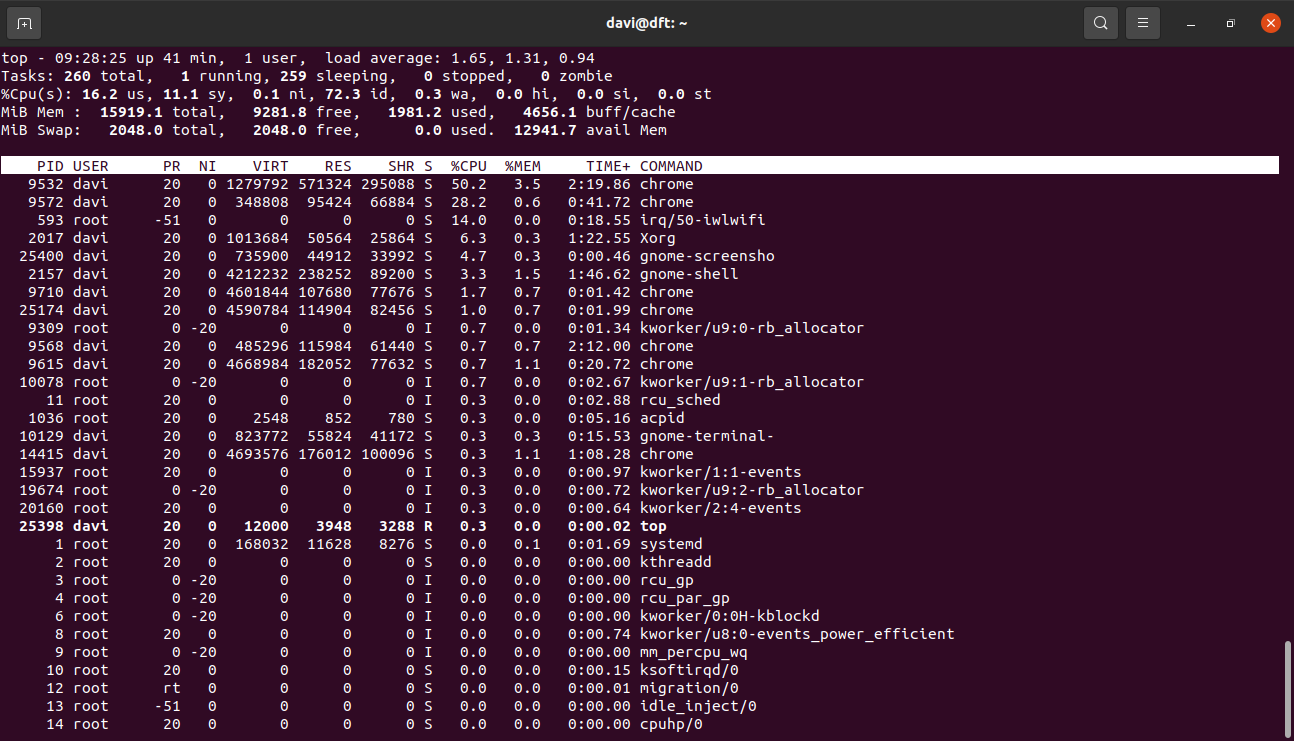
Top is probably native to most Linux distributions.
top
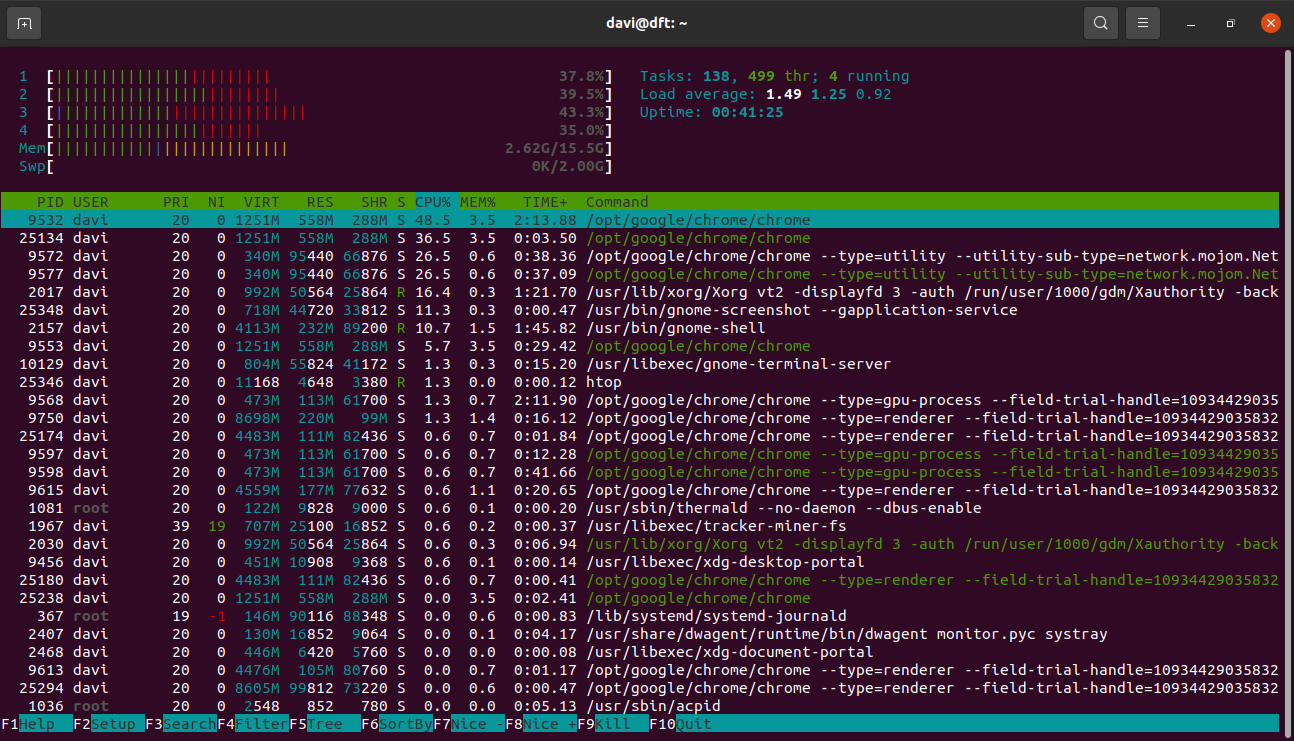
Htop is an upgraded version of Top with a more informative interface, but may require installation first.
sudo apt install htop
htop
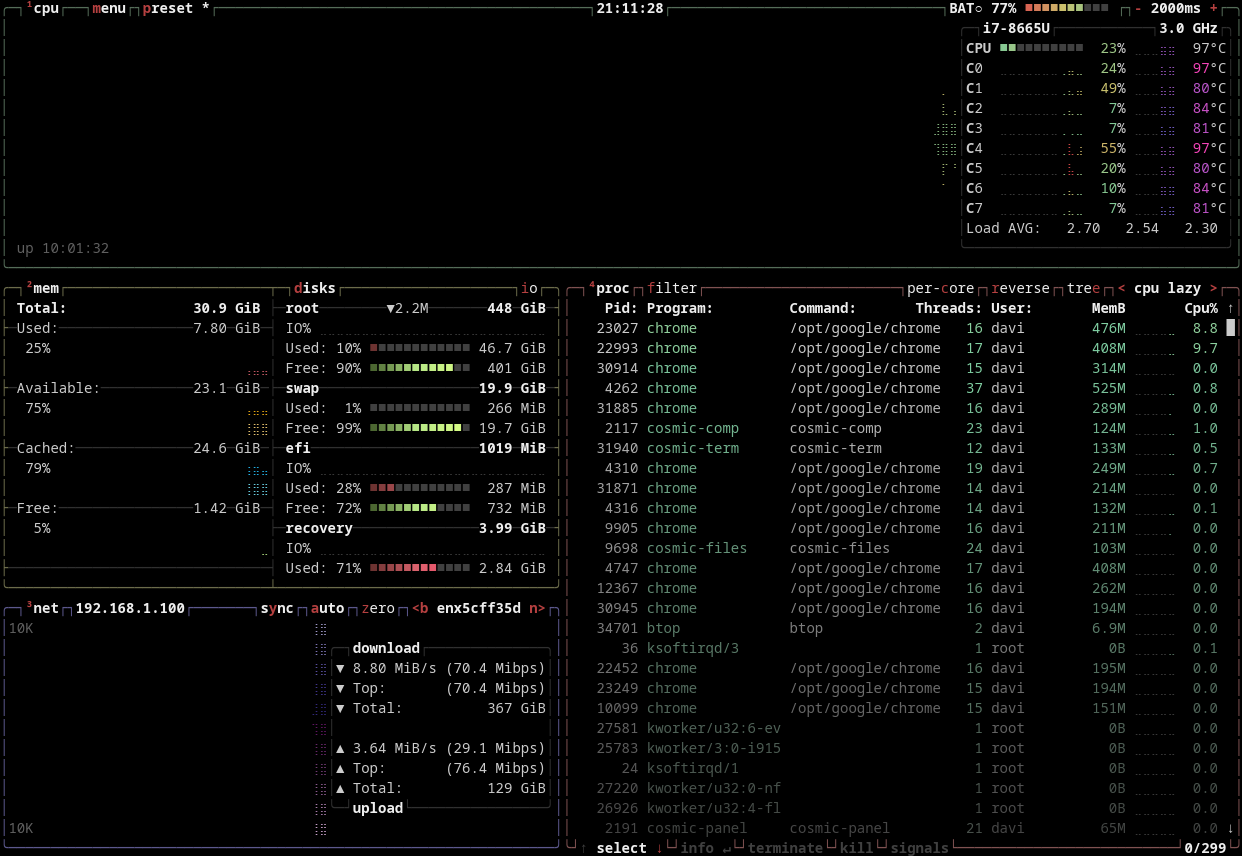
btop is another resource monitor that shows usage and stats for processor, memory, disks, network, and processes.
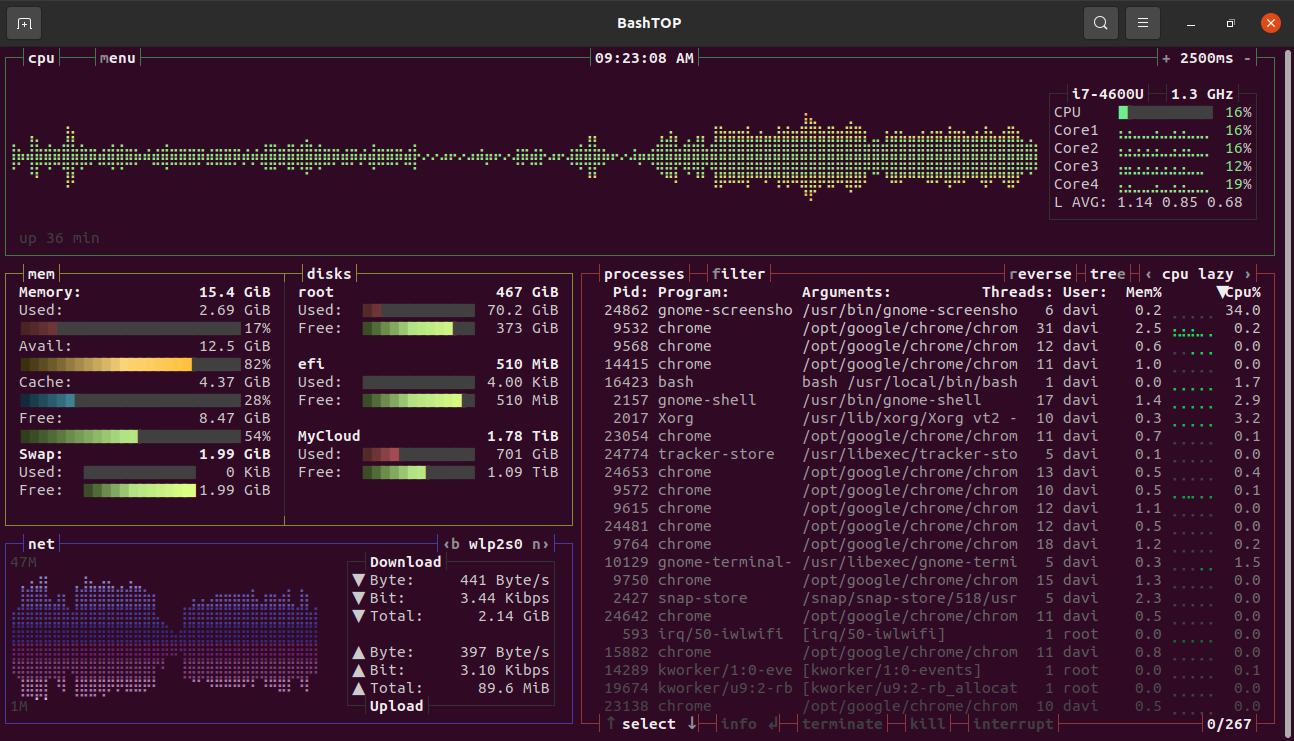
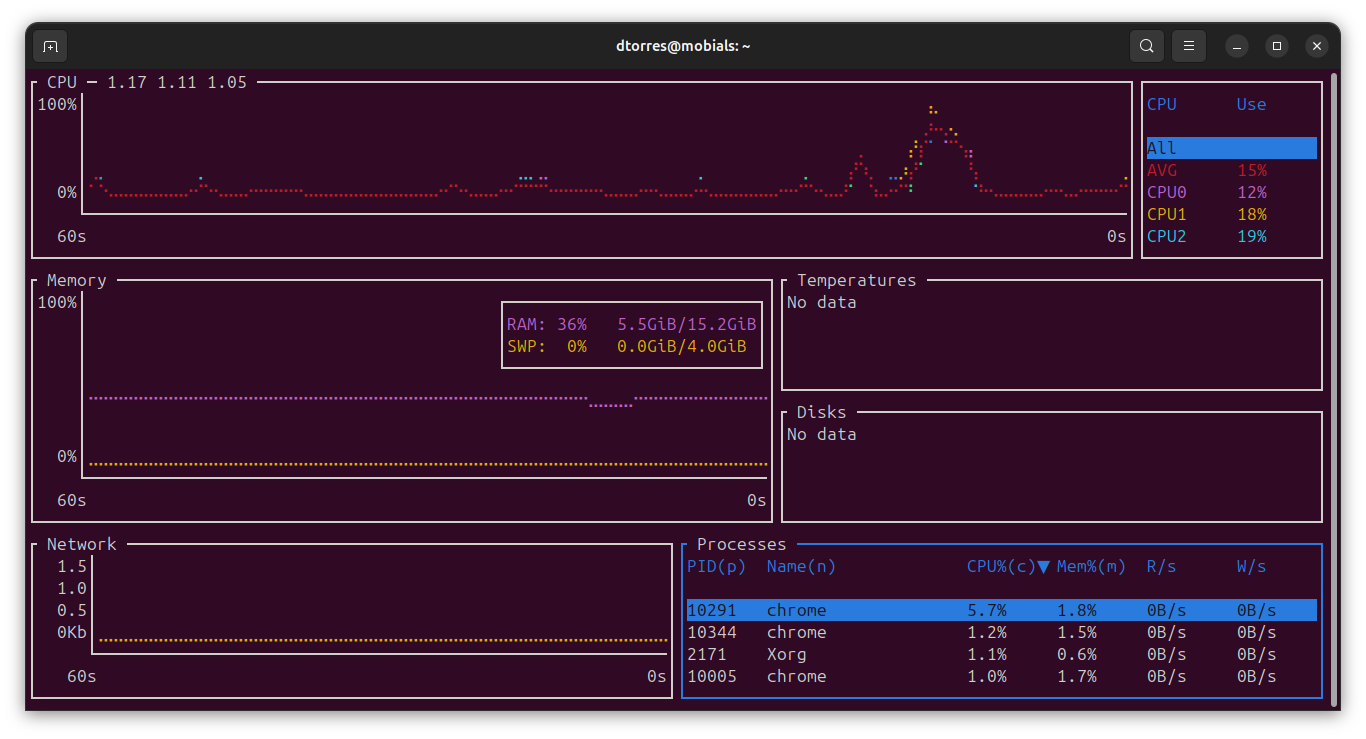
Bashtop combines the features of both with a graphical interface (even over a terminal) that makes the information much easier to read.
git clone https://github.com/aristocratos/bashtop
sudo cp bashtop/bashtop /usr/local/bin/
bashtop
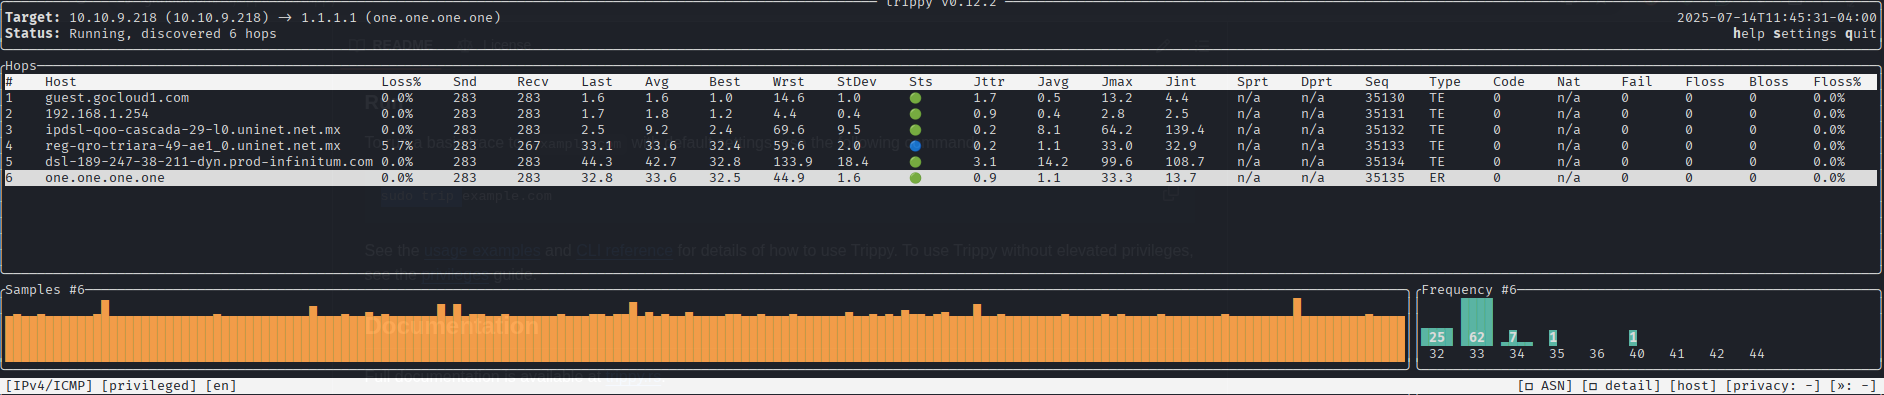
Trippy is a network analysis tool that combines traceroute and ping functionality with a TUI for issue visualization [Link].
sudo apt install trippy -y
sudo tripy 1.1.1.1
Bottom offers well-integrated mouse support for clicking to select and scrolling to zoom [Link].
sudo snap install bottom
OTHERS
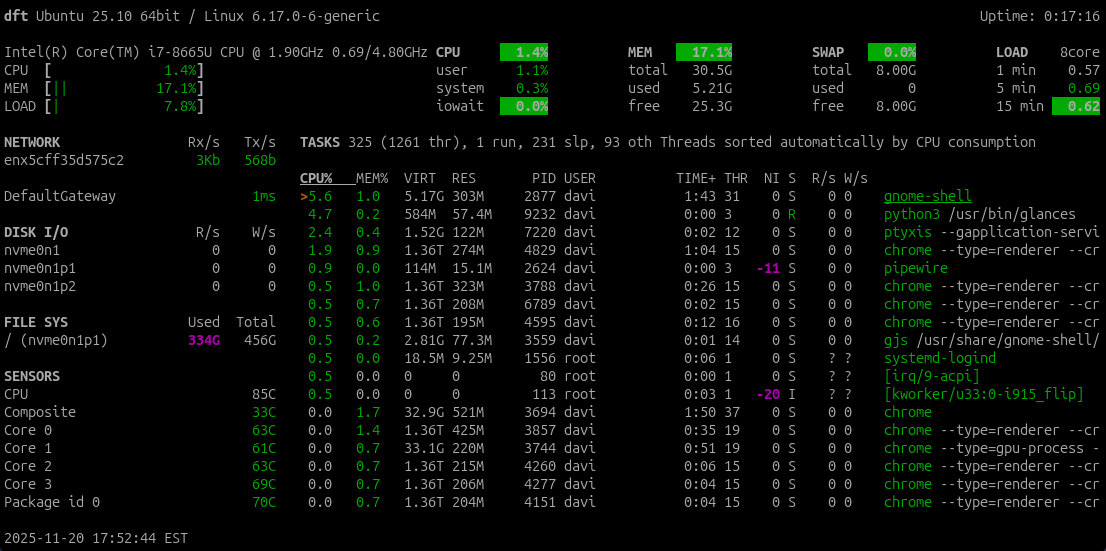
sudo apt install glances -y
glances
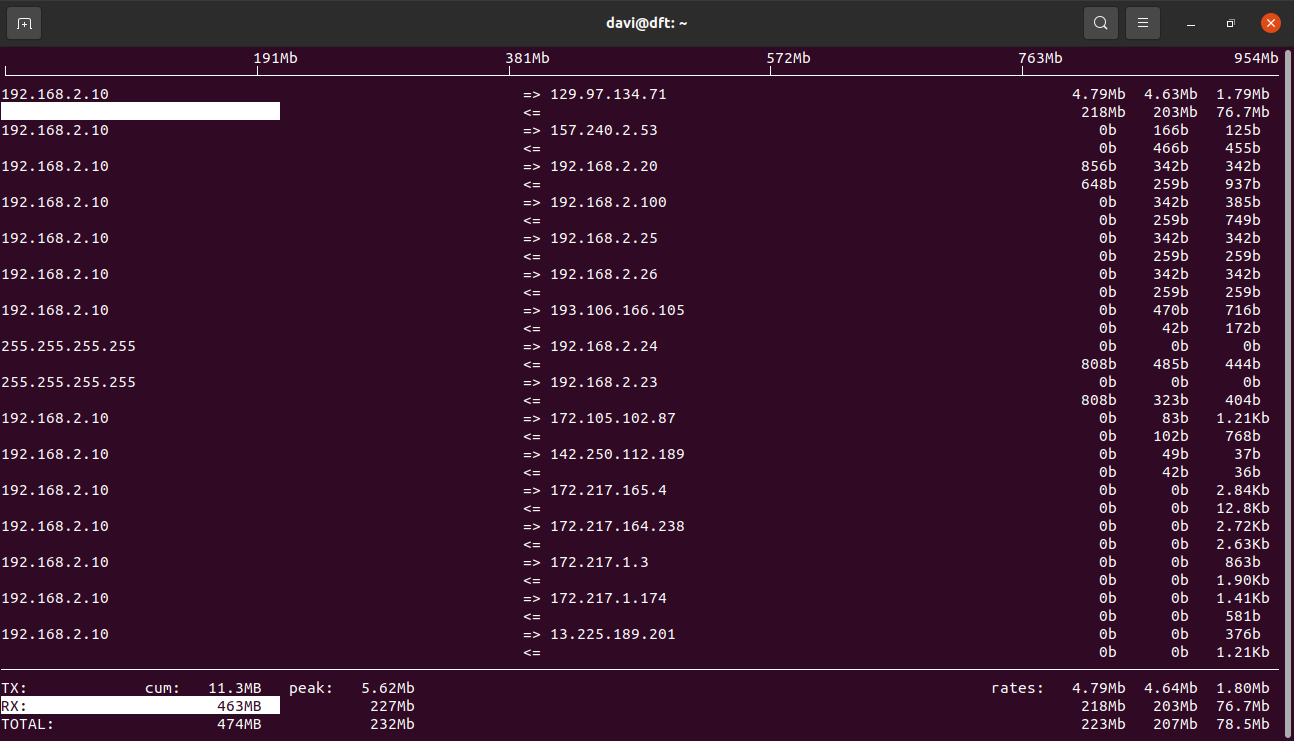
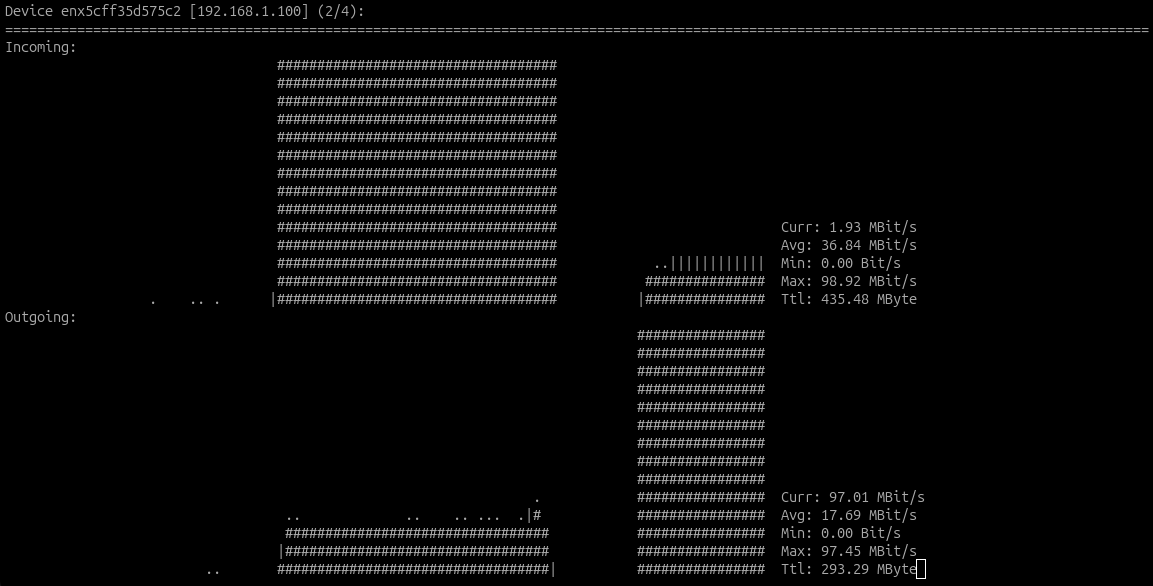
sudo apt install iftop -y
sudo iftop -i eth0 -p -n
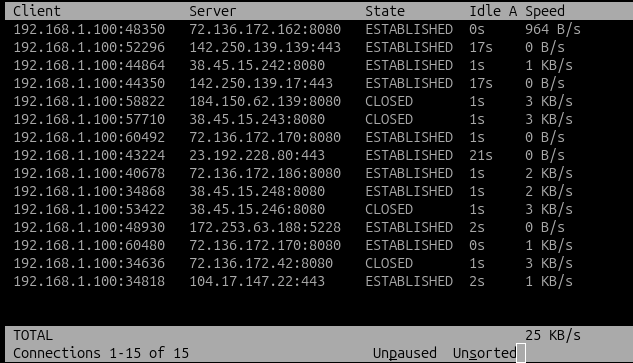
sudo apt install tcptrack -y
sudo tcptrack -i eth0
sudo apt install nload -y
nload
nload wlan0
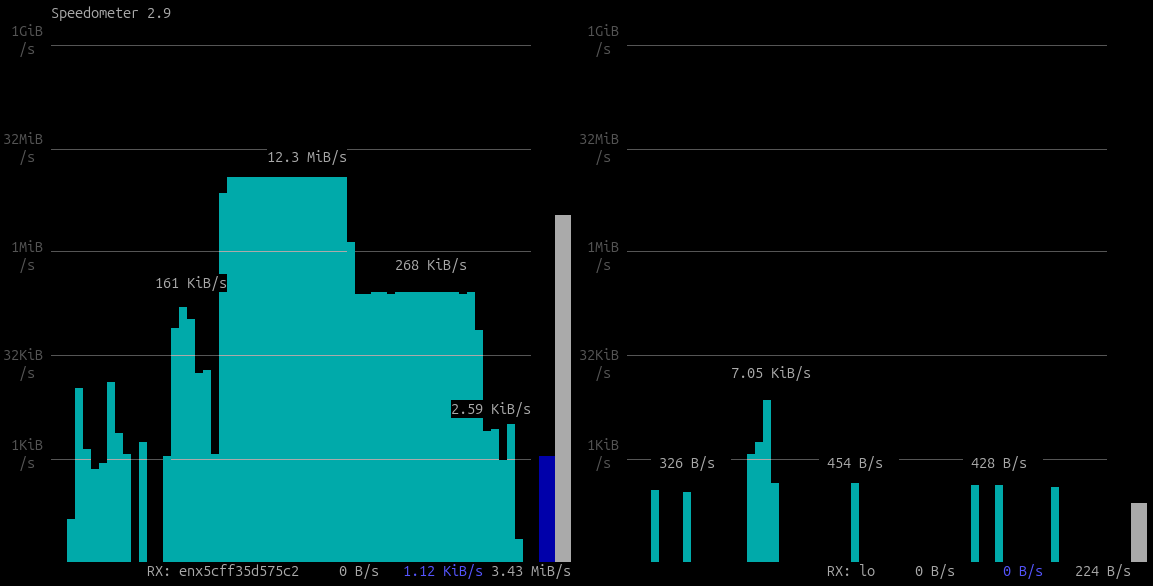
sudo apt install speedometer -y
speedometer -t eth0
speedometer -r eth0 -c -r lo
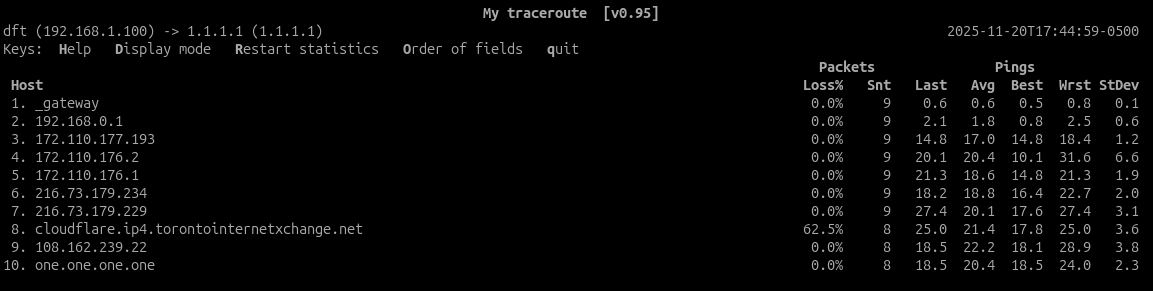
sudo apt install mtr-tiny -y
mtr 1.1.1.1
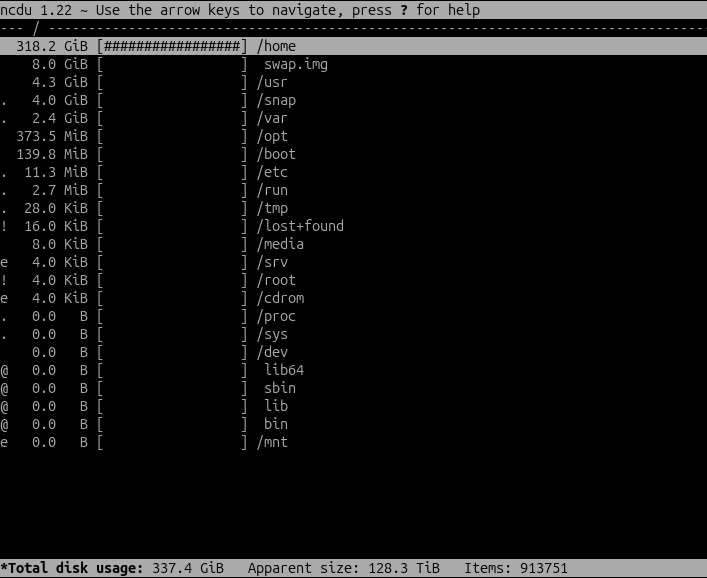
sudo apt install ncdu -y
ncdu /
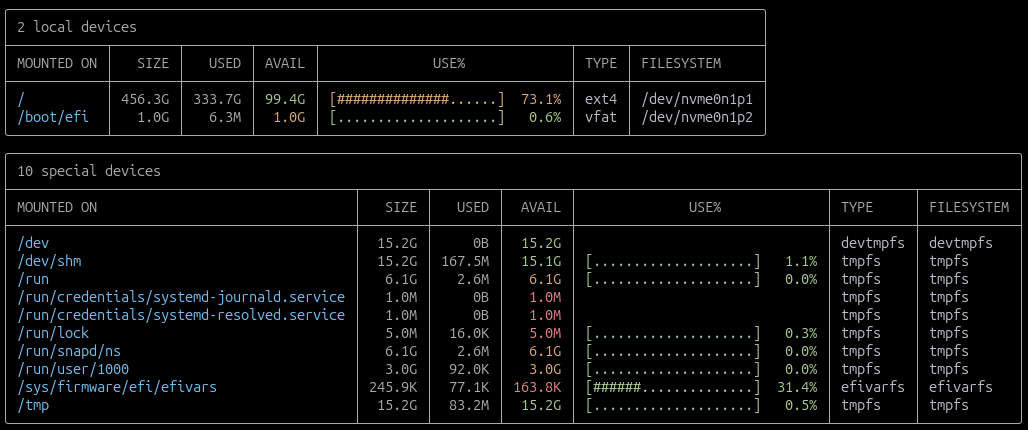
sudo apt install duf -y
duf
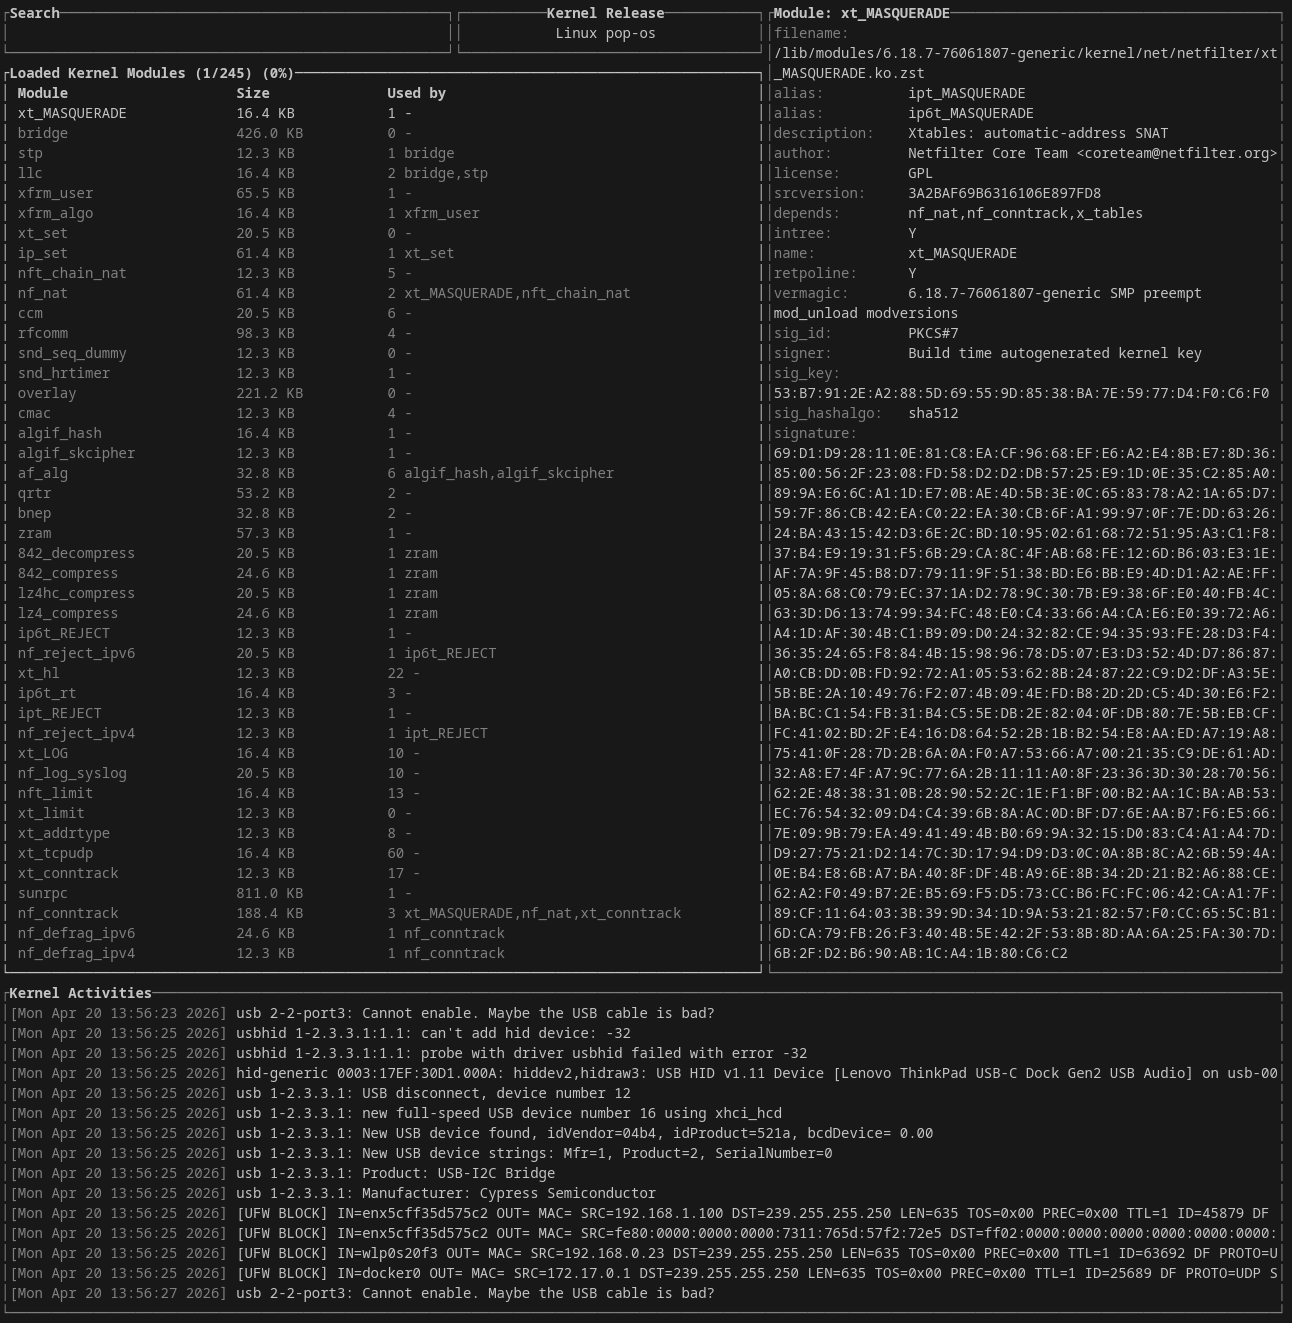
Linux Kernel Manager and Activity Monitor, aka kmon.
sudo apt install kmon -y
See additional information and source code for Glances at [Link].
Another great tool for navigating the file system and executing commands is Broot [Link].
BONUS
Check out NetData [Link], an open-source web GUI application, and its free cloud service [Link].
Similarly to the monitoring tools above, check the following CLI tools for: