INDEX
- Journal Control
- Used to view and manipulate Systemd logs.
- Remote Syslog
- Forwards log messages over an IP network.
- Log Rotating
- Allows automatic rotating, compressing, removing, and messaging of log files.
- Log Watch
- Periodically analyzes your logs for a given period and generates a report via email or output file.
- Log Check
- Automatically scans log files for problems and security violations, then sends the results via email.
- Audit Daemon
- A powerful audit framework for logging events on Linux systems.
SYSLOG PRIORITY/SEVERITY LEVELS
- 0 – Emergency
- 1 – Alert
- 2 – Critical
- 3 – Error
- 4 – Warning – Default
- 5 – Notifications
- 6 – Information
- 7 – Debug
JOURNAL CONTROL
JournalCTL (aka Journal Control) is used to query the contents of the systemd journal (systemd-journald.service).
Note: By default, journal users can only view their own logs unless they are root or belong to the adm (or systemd-journal) group (usermod -a -G adm userName).
- journalctl
- Shows the full journal contents, starting with the oldest entry.
- journalctl -r -n 10
- Shows the journal in reverse order, limited to 10 entries (newest first).
- sudo journalctl -u ssh.service -f
- Filters logs for the
sshunit and follows for real-time entries.
- Filters logs for the
- sudo journalctl –since “2021-12-31 23:59:59”
- Filters entries starting from a specific date and time.
- sudo journalctl –since “yesterday” -p err
- Filters entries by a relative time window and priority:
- –since and –until accept strings like “today”, “1 hour ago”, “2 days ago”.
- Priorities map to syslog levels and can be expressed as text or numbers (“emerg”/0, “alert”/1, “crit”/2, “err”/3, “warning”/4, “notice”/5, “info”/6, “debug”/7).
- Filters entries by a relative time window and priority:
- sudo journalctl SYSLOG_IDENTIFIER=sshd -S “13:30:00” -U “14:00:00”
- Filters entries by identifier and a since/until time range.
- sudo journalctl -k
- Shows kernel messages.
- sudo journalctl -b
- Shows messages from the current boot.
- sudo journalctl -b -2 –utc
- Shows messages from two boots ago, displayed in UTC.
- sudo journalctl –list-boots
- Lists available boot sessions with ordinal numbers and timestamps.
Journal Clean Up
sudo journalctl --verify
sudo journalctl --disk-usage
sudo journalctl --vacuum-size=200M
sudo journalctl --vacuum-files=2
sudo journalctl --vacuum-time=3d
sudo journalctl --vacuum-size=1G --vacuum-time=5d --vacuum-files=5
Customizing Configuration
sudo nano /etc/systemd/journald.conf
- Storage=
- One of “volatile”, “persistent”, “auto”, or “none”.
- Compress=
- Suffixes like K, M, and G can be used to specify larger units.
- SystemMaxUse=, SystemKeepFree=, SystemMaxFileSize=, SystemMaxFiles=, RuntimeMaxUse=, RuntimeKeepFree=, RuntimeMaxFileSize=, RuntimeMaxFiles=
- Use these variables to set disk usage limits and prevent the journal from affecting system stability.
- MaxFileSec=, MaxRetentionSec=, SyncIntervalSec=
- Define additional retention and synchronization parameters.
- ForwardToSyslog=, ForwardToKMsg=, ForwardToConsole=, ForwardToWall=, MaxLevelStore=, MaxLevelSyslog=, MaxLevelKMsg=, MaxLevelConsole=, MaxLevelWall=
- Control what messages are forwarded and where.
Finding Failures
journalctl --no-pager --since today --grep 'fail|error|fatal' --output json|jq '._EXE' | sort | uniq -c | sort --numeric --reverse --key 1
REMOTE SYSLOG
Rsyslog (aka “the Rocket-fast SYStem for LOG processing”) uses the standard BSD syslog protocol to send messages over IP, with support for additional protocols via extensions. The format of relayed messages can be customized.
Locally, rsyslog reads the journal and sorts entries based on filters to store or output information appropriately, since the journal is ephemeral and does not persist across reboots.
Server-Side
Edit the configuration file:
sudo nano /etc/rsyslog.conf
Uncomment the following lines to listen over UDP (faster, recommended):
# provides UDP syslog reception
module(load="imudp")
input(type="imudp" port="514")
Or uncomment the following lines to listen over TCP (more reliable):
# provides TCP syslog reception
module(load="imtcp")
input(type="imtcp" port="514")
Right below the uncommented lines, add:
$template RemoteLogs,"/var/log/RemoteHosts/%HOSTNAME%-%$now%.log"
if $fromhost-ip != '127.0.0.1' then -?RemoteLogs
& stop
Note: This creates a template called RemoteLogs that stores logs organized by client hostname. The template is not applied to localhost, and processing stops to prevent duplicate logs. Another commonly used variable is %PROGRAMNAME%.
Restart the service, verify it is listening on port 514, and monitor for incoming messages:
sudo systemctl restart rsyslog
sudo ss -tulpn
sudo tail -f /var/log/messages
Client-Side
Edit the configuration file:
sudo nano /etc/rsyslog.conf
Append the following lines:
*.* action(type="omfwd" target="10.10.10.10" port="514" protocol="udp")
OR
*.* action(type="omfwd" target="10.10.10.10" port="514" protocol="tcp")
For improved reliability over TCP, consider adding these flags:
*.* action(type="omfwd" target="10.10.10.10" port="514" protocol="tcp" tcp_framing="octet-counted" keepalive="on")
The legacy syntax is also supported.
For UDP:
*.* @10.10.10.10:514
For TCP:
*.* @@10.10.10.10:514
Note: The expression *.* means AllFacilities and AllSeverityLevels, respectively. Replace the IP address with the IP or hostname of your server.
Restart the service and test it:
sudo systemctl restart rsyslog
logger -t "TagName" Value
logger -t "LocalTime" $(date)
LOG ROTATING
Log rotation is an automated process in which log files are compressed, moved (archived), renamed, or deleted once they become too old or too large.
The file /etc/logrotate.conf contains the default configuration that applies to all log files unless overridden by a specific configuration.
Specific configuration files must be placed in /etc/logrotate.d. Below is an example that can be applied to the rsyslog server setup above:
/var/log/RemoteHosts/*.log {
  weekly
  rotate 26
  copytruncate
  compress
  delaycompress
  missingok
  notifempty
  create 600 root root
  maxsize 500M
  minsize 50M
}
- weekly
- Rotates the file once a week. Can also be set to daily, monthly, or yearly.
- rotate 26
- Keeps 26 rotated files.
- copytruncate
- Copies the original file, then truncates it to zero bytes in place.
- compress
- Compresses rotated files with gzip to save disk space.
- delaycompress
- Skips compression on the first rotation; compresses all subsequent ones.
- missingok
- Does not error if a log file is missing.
- notifempty
- Skips rotation if the file is empty.
- create 600 root root
- Sets the permissions on newly created log files.
- maxsize 500M
- Rotates immediately if the file exceeds this size. Supports K (kilobytes), M (megabytes), and G (gigabytes).
- minsize 50M
- Skips rotation if the file is below this size. Supports K, M, and G.
Additionally:
- sharedscripts
- Runs the prerotate and postrotate scripts only once, even when rotating multiple files, rather than once per file.
- prerotate
- A bash script block that runs before the file is rotated.
- Must end with
endscript.
- postrotate
- A bash script block that runs after the file is rotated.
- Must end with
endscript.
Note:
Logrotate is run daily by cron via the script /etc/cron.daily/logrotate, and also via systemd timers configured at /usr/lib/systemd/system/logrotate.timer and /usr/lib/systemd/system/logrotate.service (systemctl list-timers).
The combination of cron and systemd allows logrotate to run within a flexible time window, helping reduce resource contention based on system load.
To run logrotate manually or more frequently than daily (e.g., every 6 hours), use the -f (force) flag:
/usr/sbin/logrotate -f /etc/logrotate.conf
Check the health of its timer:
systemctl status logrotate.timer
LOGWATCH
Logwatch is a log parser and analyzer that generates a unified activity report for a server, delivered via the command line or email.
sudo apt install logwatch -y
sudo cp /usr/share/logwatch/default.conf/logwatch.conf /etc/logwatch/conf/
sudo nano /etc/logwatch/conf/logwatch.conf
Basic configuration:
- Output = stdout
- Prints the report to standard output (console) by default.
- Output = mail
- Sends the report by email when analysis is complete.
- See option mailer = “/usr/sbin/sendmail -t” for additional configuration.
- Also consider using MSMTP [Link] to add email capability to the system.
- Format = text
- The default format. Suitable for console output.
- Format = html
- Recommended when sending the report via email.
- MailTo = root
- Defines the local account that will receive the report.
- MailTo = [email protected]
- Use a full email address to send outside the local system.
- MailFrom = Logwatch
- Sets the sender address. Can be a local account or a full email address.
- Filename = /tmp/logwatch
- Defines where the report is saved. Requires Output to be set to file.
- Archives = No
- Uncomment to disable the archive feature, which is enabled by default.
- Range = yesterday
- The default range. Can also be set to Today or All.
- Detail = Low
- Sets the report detail level, from 0 (low) to 10 (high).
- Service = All
- Recommended to leave as All to avoid filtering any services.
Common commands:
- logwatch –help
- logwatch –range “-5 days”
- Analyzes the past 5 days of logs. The default range is the previous day.
- logwatch –range “between -7 days and -3 days” –output mail
- Analyzes a specific date range and sends the report by email.
- logwatch –service all –detail high –mailto [email protected]
- Sends a highly detailed report of all services to a specific email address.
LOG CHECK
Logcheck scans logs hourly and after each reboot for notable lines, looking for signs of misuse, security violations, or system problems.
sudo apt install logcheck -y
sudo nano /etc/logcheck/logcheck.conf
Common configuration options:
- REPORTLEVEL=”server”
- Controls the filtering sensitivity. Options range from “workstation” (low alert) to “paranoid” (highest alert).
- SENDMAILTO=”logcheck”
- Set this to the desired destination email address. E.g. SENDMAILTO=”[email protected]”
To view the list of log files being monitored:
sudo nano /etc/logcheck/logcheck.logfiles
AUDIT DAEMON
auditd is the userspace component of the Linux Auditing System, responsible for writing audit records to disk. ausearch and aureport are the tools used to view those logs.
sudo apt install auditd -y
sudo nano /etc/audit/auditd.conf
Common commands and temporary rules:
- sudo auditctl -s
- Shows the status of auditd.
- sudo auditctl -e 1
- Enables the audit flag.
- sudo auditctl -w /etc/passwd -p wrsa -k passwd_watch_key
- Watches the specified file for the following access types: r=read, w=write, x=execute, a=attribute change. Assigns an identification key for filtering.
- sudo ausearch -k passwd_watch_key
- Displays audit events matching the given key.
To make rules persistent across reboots, append them to /etc/audit/rules.d/audit.rules:
-w /etc/passwd -p wrsa -k passwd_watch_key
Then restart the service:
sudo systemctl restart auditd
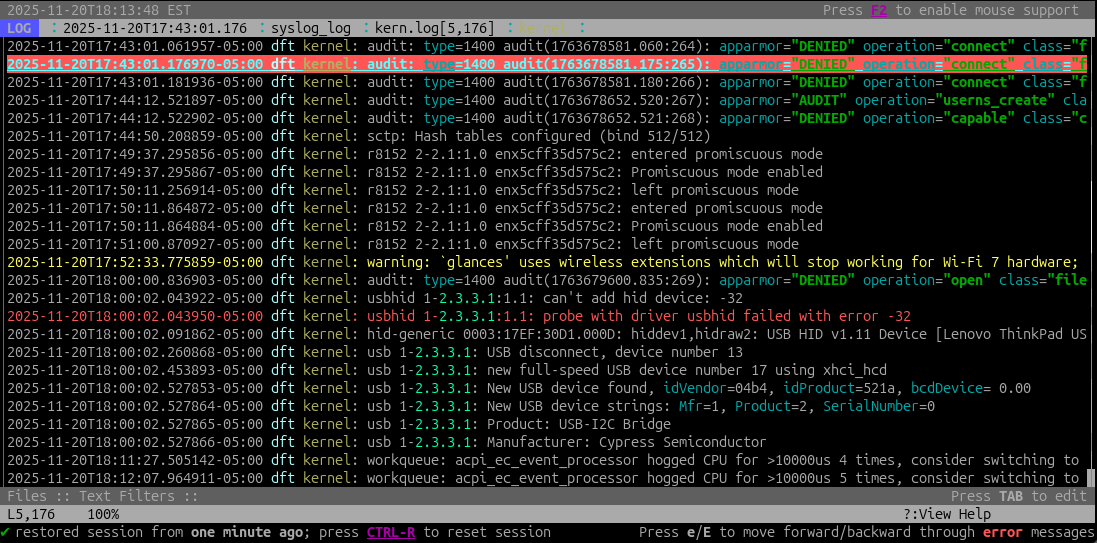
TUI NAVIGATION
The Log File Navigator (LNAV) is an excellent tool for working with logs in the terminal [Link]. It improves the log-reading experience with features like syntax highlighting, regex search, filtering, and the ability to merge multiple files into a single view [Link].
Install with APT:
sudo apt install lnav -y
Or Brew:
brew install lnav
Common usage:
lnav /var/log/syslog
lnav /var/log/syslog /var/log/apache2
journalctl -f | lnav
Key bindings:
fgoes to the next file.egoes to the next error.shift+egoes to the previous error./opens the search prompt.ngoes to the next search hit.shift+ngoes to the previous hit.
:opens the commands menu.- From here you can enable mouse mode or apply filters.
BONUS
Remote Syslog with syslog-ng [Link]. Current version 3.36.1 (2022-05-25) available at [Link].
Install syslog-ng on both the server and client:
sudo apt-get install syslog-ng -y
OR (on Ubuntu/Debian):
wget -qO - https://ose-repo.syslog-ng.com/apt/syslog-ng-ose-pub.asc | sudo apt-key add -
echo "deb https://ose-repo.syslog-ng.com/apt/ stable ubuntu-focal" | sudo tee -a /etc/apt/sources.list.d/syslog-ng-ose.list
apt-get update && apt-get install syslog-ng -y
On the server, create /etc/syslog-ng/syslog-ng.conf:
@version: 3.36
@include "scl.conf"
options {
    time-reap(30);
    mark-freq(10);
    keep-hostname(yes);
};
source s_local {
    system(); internal();
};
source s_network {
    syslog(transport(tcp));
};
destination d_logs {
    file(
        "/var/log/syslog-ng/${HOST}.txt"
        owner("root")
        group("root")
        perm(0755)
        );
    };
log {
    source(s_local); source(s_network); destination(d_logs);
};
Restart the service with sudo systemctl restart syslog-ng.
On the client, create /etc/syslog-ng/syslog-ng.conf:
@version: 3.36
@include "scl.conf"
source s_local {
    system(); internal();
};
destination d_syslog_tcp {
    syslog("10.10.10.10" transport("tcp") port(514));
};
log {
    source(s_local);destination(d_syslog_tcp);
};
Restart the service with sudo systemctl restart syslog-ng.
Remember to open the appropriate port on the server firewall to allow inbound connections.
Default ports:
- UDP – port 514
- TCP – port 601
- TLS/TCP – port 6514
READ MORE